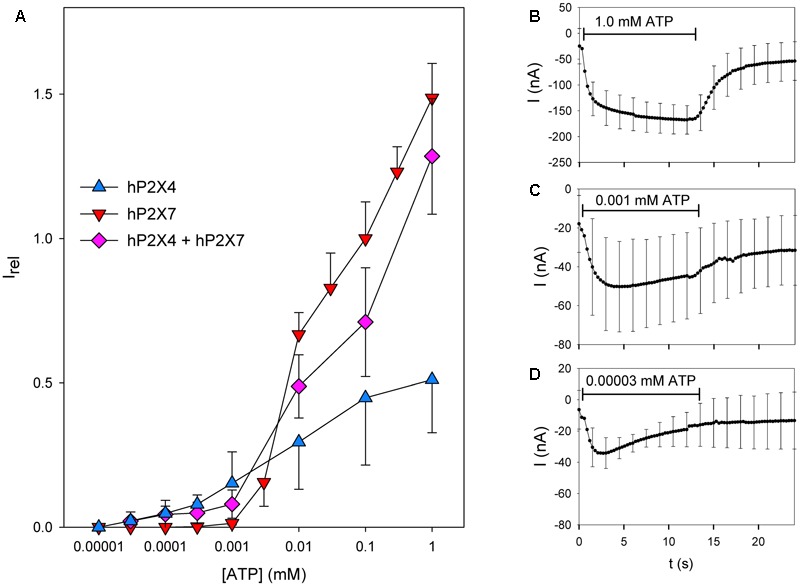
FIGURE 6.

Dependence on the ATP concentration of coexpressed hP2X4 and hP2X7 subunits. (A) Maximal current amplitudes in the presence of various ATP concentrations ([ATP]) were obtained by two-electrode voltage clamp measurements in oocytes expressing hP2X4 and/or hP2X7, as indicated. These amplitudes were measured during a 12 s lasting ATP application and normalized to the amplitude during a preceding application of 0.1 mM ATP to yield the relative current amplitude Irel. Irel values for hP2X4- or hP2X7-expressing oocytes are significantly different at all ATP concentrations. Current amplitudes of oocytes expressing hP2X4 + hP2X7 are significantly different from those of P2X7-expressing oocytes at 0.1–1 μM ATP and significantly different from those of P2X4-expressing oocytes at 0.01–1 mM ATP. Thus, the ATP concentration–response curve for hP2X4/hP2X7-coexpressing oocytes is dominated by the hP2X4 component at low ATP concentrations and by the P2X7 component at high ATP concentrations, arguing against a distinct P2X4/P2X7 phenotype regarding the agonist sensitivity. (B–D) Averaged current traces of different oocytes expressing hP2X4 and hP2X7, elicited by the second ATP application at the indicated concentrations. Data are the means ± SD from 4–10 oocytes.
