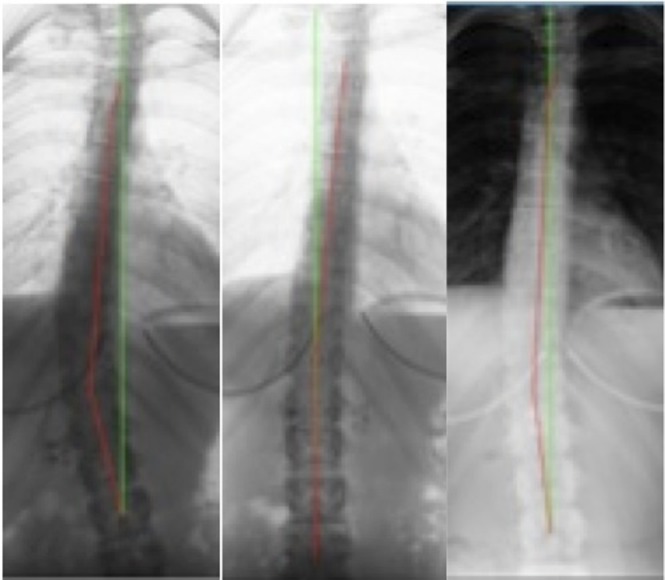
Fig. 3.

AP thoracolumbar x-rays
Green line is vertical; Red line is modified Risser-Ferguson angle; all angles reported as Cobb angles. Left: Initial view (Jan 21, 2015) revealing a 27.3° (T5–L3); Middle: ‘Stress view’ (Jan 21, 2015) with patient performing first a left thoracic translation (+TxT), then a right thoracic lateral flexion (+RzT) which showed a ‘reduction potential’ of 9.3°; Right: Post-treatment follow-up neutral standing view (May 12, 2015) showing a dramatically improved curve of 8.2°; an overall reduction/correction of 19.2° (27.3° vs. 8.2°).
