Figure 3.

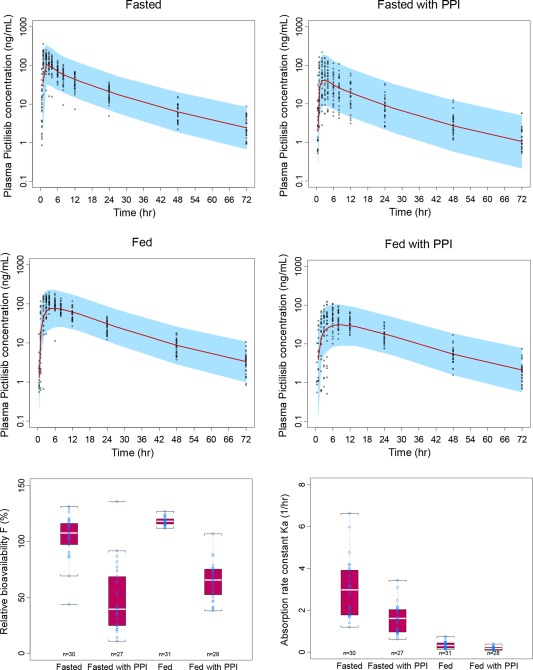
Visual predictive check (VPC) for the plasma PK profiles of pictilisib and the boxplots for the relative bioavailability (Frel) and Ka for each period.

Visual predictive check (VPC) for the plasma PK profiles of pictilisib and the boxplots for the relative bioavailability (Frel) and Ka for each period.