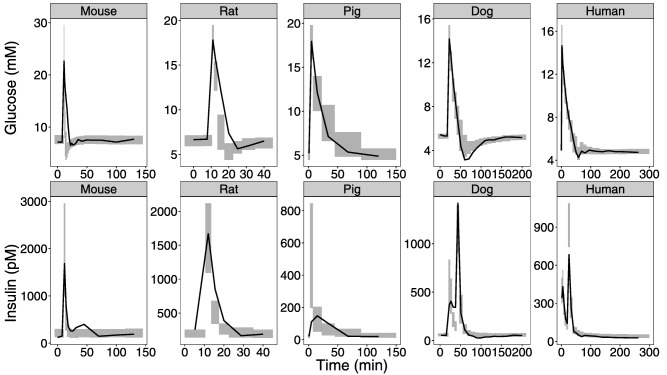
Figure 2.

Internal model evaluation of basic allometric model. Visual predictive checks are shown comparing observations with simulated glucose and insulin data for the different species when the exponent for clearance and volume are set to the empirical values of 0.75 and 1. The solid line is the median based on the observed data. The shaded area is the 95% confidence interval around the median based on the simulated data.
