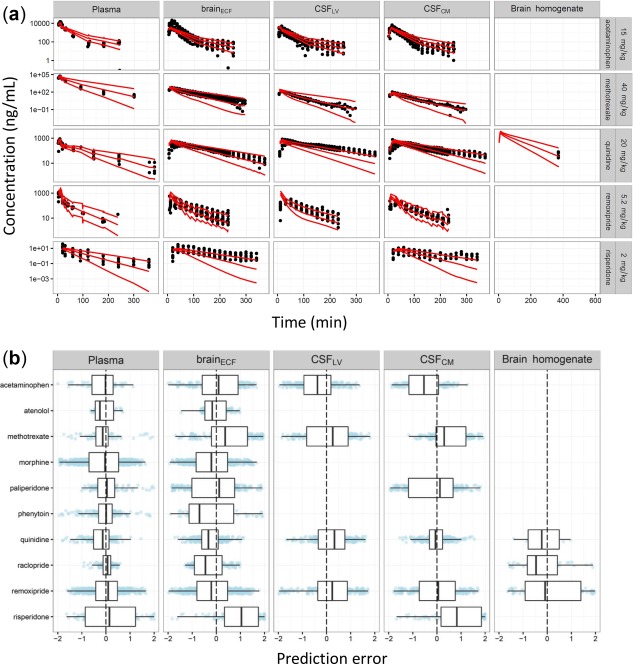
Figure 2.

Prediction accuracy of the physiologically based pharmacokinetic (PBPK) model. The plots were stratified by the central nervous system (CNS) compartments (panels). (a) Selected individual observed drug concentrations (dots) and 95% prediction interval (red lines). (b) Box‐whisker plots for the prediction errors (PEs) across all 10 drugs evaluated. Blue dots are PEs for each observation.
