

Abstract
Multiple myeloma is a fatal hematological malignancy with high rates of drug resistance and relapse. Vorinostat, a histone deacetylase inhibitor, has shown promise in enhancing efficacy when combined with current myeloma therapies. In this study, temporal changes of critical proteins and cell proliferation were measured in myeloma cells exposed to vorinostat. A model linking biomarker dynamics to cell proliferation was developed that captured vorinostat effects on signal transduction and cell viability. The model structure and parameters were fixed to describe tumor dynamics in vivo, and tumor‐specific growth and death rate parameters were estimated. The signaling model captured tumor growth inhibition in murine xenografts for a range of dose levels and regimens. This model may be used as a mechanistic bridge to link vorinostat exposure to molecular events and pharmacodynamic (PD) outcomes. It may also provide a translational platform to explore vorinostat activity as a single agent and in combination regimens.
Study Highlights.
WHAT IS THE CURRENT KNOWLEDGE ON THE TOPIC?
☑ Vorinostat is a pan‐HDAC inhibitor that has exhibited efficacy as a combinatorial agent in multiple myeloma; however, the determinants of its concentration and schedule dependency need additional evaluation.
WHAT QUESTION DID THE STUDY ADDRESS?
☑ This study addresses whether a mechanistic model based on in vitro signal modulation can aid in characterization of tumor regression and vorinostat exposure‐response in vivo.
WHAT THIS STUDY ADDS TO OUR KNOWLEDGE
☑ Dynamics of critical intracellular biomarkers can link exposure and cell proliferation. PD models based on mechanistic signaling may aid in better capturing complex tumor kinetics in comparison to parsimonious PK/PD models.
HOW MIGHT THIS CHANGE DRUG DISCOVERY, DEVELOPMENT, AND/OR THERAPEUTICS?
☑ The study offers a quantitative signaling model for vorinostat effects in multiple myeloma that can be utilized to explore vorinostat dosing schedules as a single agent and in combination therapy and to better identify the critical determinants of its PD effects.
Multiple myeloma is a hematological malignancy characterized by abnormal proliferation of plasma cells. Clinical manifestations for multiple myeloma include renal insufficiency, anemia, and bone diseases,1, 2 whereas the deregulation of important survival pathways (e.g., nuclear factor‐kappa β (NF‐κβ), Janus kinase 2/signal transducer and activator of transcription 3 (JAK2/STAT3), and protein kinase B (AKT)) are major contributors to its pathophysiology.3 Despite significant improvements in progression‐free survival, patients still exhibit intrinsic and acquired resistance and eventually stop responding to any kind of therapy.4 Ultimately, this makes multiple myeloma untreatable and partly explains its low 5‐year survival rate of 44%.5 There is an unmet need for new drug therapies, either as single agents or in combination, that can overcome resistance and improve efficacy.
Vorinostat, a pan‐histone deacetylase (HDAC) inhibitor, has demonstrated in vitro and preclinical activity in multiple myeloma, especially in combination with proteasome inhibitors like bortezomib.6, 7, 8 Vorinostat acts by inhibiting the activity of HDAC enzymes, leading to acetylation of histones and a transcriptionally permissive, relaxed chromatin state. This results in accumulation of acetylated proteins and altered transcription of several genes. Expression of the cell cycle regulator p21 and pro‐apoptotic proteins p53 and caspase 3 are induced, whereas expression of the prosurvival signal transducer and activator of transcription 5 and B‐cell lymphoma 6 protein (BCL6) family of genes is repressed. Vorinostat also causes accumulation of reactive oxygen species and cellular stress, leading to antiproliferative as well as cytotoxic effects.9, 10 The potential synergy of vorinostat and bortezomib is attributed to the upregulation of p53, caspases 8, 9, and 3, and p21, inhibition of Bcl‐2 and Bcl‐xL, and aggravation of stress pathways due to accumulation of protein aggregates by the combined inhibition of proteasome and aggresome formation.6, 7, 8 However, in spite of promising results from in vitro and preclinical studies, a clinical study revealed no significant differences in the overall survival among patients treated with a vorinostat and bortezomib combination vs. patients treated with bortezomib alone. In contrast, there was a difference in progression‐free survival, possibly suggesting the need for further optimization of treatment schedules for better overall efficacy.11 There is a substantial lack of systematic studies elucidating vorinostat pharmacodynamics (PD) or exposure‐response relationships in a quantitative manner. A mechanistic model‐based approach would provide a much needed platform for exploring treatment schedules and combination regimens.
In this study, we developed a computational model that quantitatively describes intracellular protein dynamics in response to in vitro vorinostat exposure. This model was used to bridge the delay between in vivo drug exposure and tumor growth inhibition. In addition, the model was compared with traditional approaches generally used for describing chemotherapeutic effects on tumor burden.12, 13 Our study demonstrates that constructing more mechanistic models of drug action provides insights into regulation of intracellular biomarkers by vorinostat and can connect these regulators to in vivo tumor burden dynamics. This model could be adapted to rationally explore new regimens for vorinostat as a single agent or in combination.
METHODS
Cell line and reagents
U266 human myeloma cells were purchased from ATCC (Manassas, VA) and vorinostat from Selleckchem. Cells were cultured in Roswell Park Memorial Institute (RPMI)‐1640 medium (Life Technologies, Grand Island, NY) supplemented with 15% fetal bovine serum (ATCC, Manassas, VA) and 1% penicillin/streptomycin (Life Technologies). WST‐1 was purchased from Roche Life Science (Indianapolis, IN). Radioimmunoprecipitation assay lysis buffer and primary antibodies for poly ADP‐ribose polymerase (PARP; catalog #9532), Bcl‐xL (#2764), p53 (#2527), p21 (#2947), phosphorylated NF‐κβ (pNF‐κβ, #3033), NF‐κβ (#6956), and β‐actin (#3700) were purchased from Cell Signaling Technology (Danvers, MA). Primary antibody for α‐ tubulin (#5286) and mouse and rabbit secondary antibodies were procured from Santa Cruz Biotechnology (Santa Cruz, CA). Chemiluminescence (ECL) Western blotting substrate and Halt protease and phosphatase inhibitor cocktail were obtained from Thermo Fisher Scientific (Waltham, MA).
Protein dynamics using immunoblotting
U266 cells were plated in 10 cm2 culture dishes at a density of 5 × 10⁶ cells/10 mL culture medium. Cells were exposed to 2 and 5 μM vorinostat, and samples were collected over 48 hours. Cell samples were lysed for 30 minutes on ice in radioimmunoprecipitation assay buffer supplemented with Halt protease and phosphatase inhibitor and phenylmethylsulfonyl fluoride and were centrifuged at 14,000 rpm for 20 minutes at 4°C. Equal amount of proteins for each sample were separated by sodium dodecyl sulfate‐polyacrylamide gel electrophoresis gel. Primary and secondary antibody incubation was done for 12–16 hours and 1 hour respectively with TRIS‐buffered saline + 0.1% Tween 20 washes in between. Protein bands were visualized with Pierce ECL Western Blotting Substrate and quantified by Image Lab Software (Bio‐Rad, Hercules, CA). Protein expressions were normalized to vehicle controls to the 0 time point. Phosphorylated proteins and cleaved proteins were normalized to their total protein expression. All experiments were performed in triplicate.
In vitro vorinostat kinetics
Vorinostat was incubated in cell culture medium (RPMI 1640 medium supplemented with 15% fetal bovine serum and 1% penicillin/streptomycin) at 37°C at concentrations of 2 and 5 µM. Samples were collected for up to 120 hours, and analyzed using a liquid chromatography tandem mass spectrometry method developed internally (see details in the Supplementary Materials). The in vitro kinetic profiles for 2 and 5 µM were fitted separately to a bi‐exponential function (Supplementary Figure S1 and Table S1).
In vitro cell proliferation
U266 cells were seeded at 10,000 cells/well in 96‐well plates and exposed to vorinostat at concentrations of 1, 2, and 5 µM. Cell viability was measured using the WST‐1 reagent assay over 96 hours.
Mechanism‐based vorinostat pharmacodynamic model development
Intracellular biomarkers critical to multiple myeloma survival and apoptotic pathways,3 proteins implicated in vorinostat mechanisms of action, and key markers of vorinostat combinatorial interactions with bortezomib,8, 9, 14 were incorporated into a dynamic model. The final model is depicted in Figure 1. Vorinostat concentration (CV) was represented by a bi‐exponential function used to describe the in vitro time course. Protein dynamics were described using the basic structural components of indirect response models15 or time‐dependent transduction models.16
Figure 1.
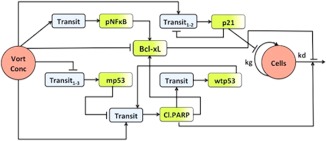
Schematic of signaling model linking vorinostat exposure‐response relationships in multiple myeloma cells and xenografts. “Vort Conc” represents vorinostat pharmacokinetics (PK), which was a bi‐exponential in vitro degradation profile or a two‐compartment in vivo PK model. “Cells” denotes the final pharmacodynamic response (U266 in vitro cell proliferation or in vivo tumor volume). The shaded green compartments for p21, cleaved poly ADP‐ribose polymerase (PARP), Bcl‐xL, p nuclear factor‐kappa β (NF‐κβ), and p53 represent the measured relative expressions of these proteins, whereas the blue compartments represent empirical transit compartments. Stimulation is denoted by  and inhibition is denoted by
  .
.
A nonlinear Hill function17 was used to define vorinostat stimulation of p21 synthesis with kin_p21 as the zero‐order production rate constant, ktr_p21 the mean transit rate constant, Smax_p21 the maximal stimulation, and SC50_p21 as the concentration of vorinostat eliciting half maximal effect. Three transit compartments were needed to capture the delay in modulation of p21. A negative feedback from the last transit compartment on the production rate of p21 was incorporated to account for the decrease in p21 after 24 hours despite continuous drug exposure. A power coefficient (γp21) was added to capture the peak p21 response:
| (1) |
| (2) |
| (3) |
pNF‐κβ dynamics were described with a production rate constant kin_ pNF‐κβ, one transit compartment with transit rate constant ktr_pNFκB, and a linear stimulation coefficient SpNF‐κβ:
| (4) |
| (5) |
Bcl‐xL was altered by stimulation of its production rate constant (kin_BclxL) via pNF‐κβ and its degradation rate constant (kout_BclxL) by cleaved PARP. To account for the immediate decline in Bcl‐xL upon drug treatment, a direct linear inhibitory coefficient (IBclxL) was introduced. The modulation by cleaved PARP allowed for the observed sustained inhibition of Bcl‐xL18:
| (6) |
Vorinostat stimulates wild type p53 (wtp53) and inhibits mutant p53 (mp53) expression.10, 19, 20 In this study, p53 initially decreased, began to return to baseline around 24 hours, and eventually increased beyond the baseline. U266 cells are heterozygous with respect to p53 (i.e., they have mutant as well as wild type p53 alleles),21 thus offering the potential of exhibiting contrasting vorinostat effects. In order to accommodate the potential dual effect of vorinostat in U266 cells, p53 was split into two populations – mutant and wild type p53. The measured p53 is the sum total of both protein populations. Vorinostat inhibits the synthesis rate constant of mp53 (kin_mp53) via a linear inhibitory coefficient (Imp53). Four transit compartments (n in the equations below represent transit compartment number) with a mean transit rate constant ktr_mp53 and a power coefficient (γmp53) were necessary to capture the delay and magnitude of the inhibitory effect:
| (7) |
| (8) |
| (9) |
The increase in wtp53 followed the decrease in mp53, and so an indirect stimulatory effect on the production rate constant (kin_wtp53) through cleaved PARP was incorporated. Increase in cleaved PARP preceded the increase in wtp53 or the decrease in mp53 expression, hence, a direct vorinostat stimulatory effect via a linear stimulatory coefficient (Scl.PARP) was included. Although the reason for the increase in cleaved PARP expression before p53 activity cannot be postulated from the current data, it has been previously shown that vorinostat may cause apoptosis independent of p53.22 One transit compartment was sufficient to capture the temporal trends for wtp53 and cleaved PARP. The ratio of wtp53 and mp53 also regulated the expression of PARP, with wtp53 stimulating PARP and mp53 inhibiting it. Eqs. 10–13 describe the interplay between wtp53 and cl.PARP, in which ktr_wtp53 and ktr_cl.PARP represent the mean transit rate constants for wtp53 and cl.PARP, and γcl.PARP represents the power coefficient for the cl.PARP effect:
| (10) |
| (11) |
| (12) |
| (13) |
Eq. (14) defines the final PD response (R or cell proliferation). The growth and death of the cells was described using an exponential growth rate constant (kg) and first‐order death rate constant (kd). The balance of cell cycle regulator p21, anti‐apoptotic Bcl‐xL, and pro‐apoptotic PARP regulated final cell viability. p21 inhibits kg, Bcl‐xL inhibits kd, and cl.PARP stimulates cell death:
| (14) |
All protein profiles and cell proliferation measurements were normalized, thus the initial conditions for all equations were set to 1, and the rate constants for production and loss of response were equivalent: kin= kout×R(0).15 As the data were normalized, (2 ‐ BclxL) is 1 under baseline conditions and limits the stimulation of cell death due to Bcl‐xL inhibition to twofold (i.e., function approaches 2 as Bcl‐xL approaches 0).
Vorinostat in vivo pharmacokinetics and pharmacodynamics
Pharmacokinetic (PK) and PD data for in vivo modeling were extracted from literature and digitized using GraphClick software (http://www.arizona-software.ch/graphclick/). The PK data consisted of a 10 mg/kg single i.v. bolus administered to female BALB/c nude mice,23 and PD data consisted of CB‐17 SCID mice bearing patient derived LAGκ‐1β multiple myeloma tumors treated with a 35 day vorinostat dosing regimen of 30, 60, or 100 mg/kg for 5 consecutive days every week, and 100 or 300 mg/kg once daily on 2 consecutive days every week.24 The 30 mg/kg dosing group was not included in this analysis as the tumor volume for these animals was greater than the vehicle control animals.
Translation of cellular dynamic model for describing tumor growth inhibition in murine xenografts
Vorinostat PK in mice was described using a two‐compartmental model with first‐order elimination and intercompartmental distribution rate constants. PK parameter estimates were fixed, and simulated PK profiles were used as drivers for the signaling model. All parameters for the signaling model were fixed to in vitro estimates. Only system parameters specific to tumor xenografts were estimated, including initial tumor volume (TV0), tumor growth rate (kg), and death rate constants (kd). Threshold parameters for p21 and cleaved PARP were introduced in the model (Eq. (14)) to allow for flexibility in capturing the nondose (concentration) proportional PD responses (tumor regression). Estimation of both threshold parameters allowed for assessment of fold‐change in these biomarkers required to elicit their effect. Tumor volume is modulated only when fold‐change of the particular biomarker exceeds its estimated threshold.
For example, if p21 > p21_threshold, then:
| (15) |
else:
| (16) |
Data analysis
Naïve pooled analysis with maximum likelihood estimation in ADAPT525 was used for modeling. The variance model was defined as: VAR = (σ1+σ2•Y)2, with σi representing estimated variance parameters, and Y the model predicted value for protein profiles, cell proliferation, or tumor volume. Model evaluation and selection was guided by goodness of fit criteria that included: Akaike information criteria, precision and confidence intervals on parameter estimates, visual inspection of model fits, and examination of residuals.
RESULTS
Cellular mechanism‐based vorinostat pharmacodynamic model
The mechanism‐based dynamic model linking vorinostat exposure, signaling pathways, and cell proliferation is depicted in Figure 1. In vitro vorinostat concentrations were described with a fitted bi‐exponential function (Supplementary Figure S1 and Table S1) and served as a driving function for protein dynamics. Representative Western blots for cleaved PARP and Bcl‐xL show that vorinostat effectively stimulates and inhibits key apoptotic signaling at both the tested concentrations (Figure 2). The model fitted profiles along with the experimental data for p21, p53, Bcl‐xL, pNF‐κβ, cleaved PARP, and cell proliferation are shown in Figure 3. Overall, the model reasonably captured the trends at the two vorinostat concentrations (2 and 5 μM) with one set of system parameters (Table 1).
Figure 2.
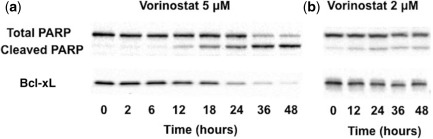
Representative immunoblotting time course of vorinostat effects on cleaved poly ADP‐ribose polymerase (PARP) (a) and Bcl‐xL (b) n U266 cells at 5 and 2 μM.
Figure 3.
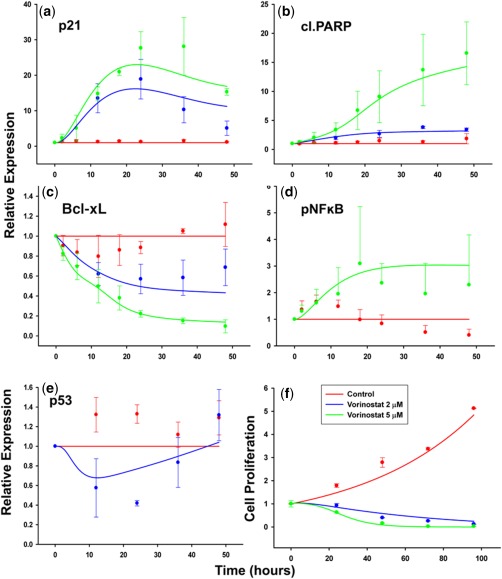
Time course of p21 (a), cleaved poly ADP‐ribose polymerase (PARP) (b), Bcl‐xL (c), pNF‐κB (d), p53 (e), and U266 cell proliferation (f) under vorinostat exposure (2 or 5 μM). Symbols represent experimentally measured data points, error bars represent SD (n = 3), and lines represent model‐fitted profiles (red = control; blue = vorinostat 2 μM; and green = vorinostat 5 μM).
Table 1.
Parameter estimates for vorinostat cellular signaling model
| Parameter | Unit | Definition | Estimate | CV% |
|---|---|---|---|---|
| ktr_p21 | h−1 | p21 transit rate constant | 0.121 | 0.53 |
| ktr_pNF‐κβ | h−1 | pNF‐κβ transit rate constant | 0.171 | 8.77 |
| kout_BclxL | h−1 | Bcl‐xL removal rate constant | 0.186 | 159.6 |
| ktr_cl.PARP | h−1 | cl.PARP transit rate constant | 0.131 | 11.9 |
| ktr_mp53 | h−1 | Mutant p53 transit rate constant | 0.497 | 6.14 |
| ktr_wtp53 | h−1 | Wild type p53 transit rate constant | 0.032 | 1.42 |
| Smax_p21 | – | Maximum stimulation for p21 | 4840 | 4.75 |
| SC50_p21 | μM | Vorinostat concentration eliciting half maximal stimulation of p21 | 6.57 | 1.21 |
| SpNF‐κβ | μM−1 | pNF‐κβ stimulatory coefficient | 0.629 | 0.744 |
| IBclxL | μM−1 | Bcl‐xL inhibitory coefficient | 0.109 | 97.3 |
| Scl.PARP | μM−1 | cl.PARP stimulatory coefficient | 45.7 | 33.9 |
| Imp53 | μM−1 | Mutant p53 inhibitory coefficient | 0.202 | 5.22 |
| γp21 | – | Power coefficient for p21 | 0.609 | 1.06 |
| γcl.PARP | – | Power coefficient for cl.PARP | 0.241 | 6.44 |
| γmp53 | – | Power coefficient for mutant p53 | 5.00 | N/A |
| kg | h−1 | Cell growth rate constant | 0.020 | 74.5 |
| kd | h−1 | Cell death rate constant | 0.0036 | 33.0 |
CV, coefficient of variation; mp53, mutant p53; N/A, not applicable; NF‐κβ, nuclear factor‐kappa β; p21, a cyclin‐dependent kinase inhibitor; PARP, poly ADP‐ribose polymerase; wtp53, wild type p53.
Initially, the 2 μM in vitro dataset was not used for model development and was assigned to be an external dataset for model qualification purposes. Using a simple linear coefficient based on the 5 μM vorinostat concentration data under predicted the magnitude of the p21 response to 2 μM vorinostat. Inclusion of all concentration data with nonlinear stimulation (Eq. (1)) was necessary to capture the exposure‐response for both concentrations (Figure 3 a). Three transit compartments (Eqs. 1–3) characterized the delay in p21 upregulation by vorinostat. The total mean transit time was estimated to be 24.8 hours (ktr_p21 = 0.121 h−1; Table 1), which corresponds with the peak response. Feedback from the third transit compartment to the first one effectively captured the decrease in p21 expression after 24 hours (Figure 3 a).
The estimated value for the stimulatory coefficient for pNF‐κβ (SpNF‐κβ = 0.629 μM−1; Table 1) was relatively low, suggesting that the upregulation of pNF‐κβ is not a dominant vorinostat effect. Concentration‐dependent decrease in Bcl‐xL was observed with the higher vorinostat concentration (5 μM), causing a near‐complete inhibition (Figure 3 c). No significant delay was observed in the downregulation of Bcl‐xL expression, with the decrease occurring before the upregulation of pro‐apoptotic cleaved PARP (Figure 3 b,c). This suggests an upstream influence and, hence, a direct inhibitory coefficient modulated by vorinostat concentration was added.
The model was able to capture the complex profile of p53, with an initial decrease followed by an increase at around 20 hours (Figure 3 e). Vorinostat did not completely inhibit the mutant p53 population (Figure 3 e), and this was reflected in the estimated inhibitory coefficient for mutant p53 (Imp53 = 0.202 μM−1; Table 1). The increase in wtp53 was significantly delayed (around 24–30 hours) in comparison to any other measured biomarker, hence, p53 stimulation was modeled as a secondary effect via cleaved PARP. One additional transit compartment with a total transit time of 31.3 hours (ktr_wtp53 = 0.032 h−1; Table 1), reasonably fit the wtp53 profile and the overall total p53 profile simultaneously.
Cleaved PARP exhibited a relatively greater expression at higher vorinostat concentration (Figure 3 b). A linear stimulatory coefficient was sufficient to describe cleaved PARP dynamics at both concentrations. An exponential growth rate constant and a first‐order death rate constant well characterized U266 cellular proliferation under control and vorinostat treatments (Figure 3 f) and were estimated with reasonable precision (Table 1).
Translation of vorinostat cellular dynamic model to xenografts
The in vitro signaling model was used to bridge vorinostat PK and tumor progression. All the parameters for the signaling model were fixed to their in vitro estimates (Table 1). A two‐compartment model with first‐order elimination described the concentration‐time profile after a 10 mg/kg i.v. bolus dose, and the model parameters were estimated with good precision (Supplemental Figure S2 and Table S2). Fixed PK driving functions were used to simulate protein dynamics for the in vivo tumor growth inhibition study. In vivo vorinostat exposures (Cmax) were in the range of 0.2–2.2 μM, which are comparable to in vitro exposures. The simulated profiles for p21, cleaved PARP, and Bcl‐xL are provided in Figure 4 a,b,c. All three proteins exhibited a dose‐dependent increase or decrease in expression, but the separation among dosing regimens was more distinct for p21 and cleaved PARP. For the 60 and 100 mg/kg q.d. × 5 day dosing regimens, p21 expression reached a maximum capacity and did not increase further with consecutive doses in the same week (Figure 4 a). This could be a result of the nonlinear stimulation function (Eq. (1)) that controls p21 expression. In contrast, for cleaved PARP and Bcl‐xL, an increase and decrease was observed (respectively) with each consecutive dose. For all three proteins, the peak (or nadir) of response occurred with the highest dose level (300 mg/kg q.d. × 2 day dosing). Because Bcl‐xL has a counter feedback loop stimulated by pNF‐κβ (and pNF‐κβ is stimulated by vorinostat; Eqs. 4–6), a minor upregulation of Bcl‐xL is observed, especially at the highest dose level.
Figure 4.
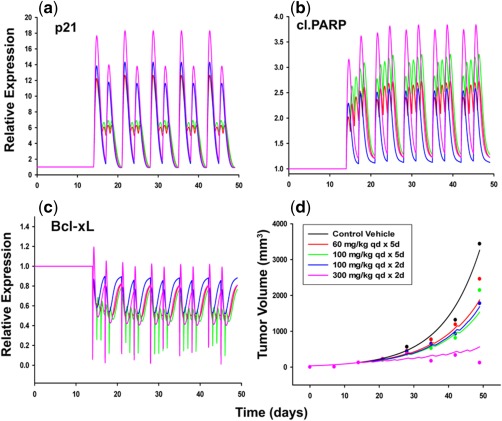
Simulated protein dynamics for p21 (a), cleaved poly ADP‐ribose polymerase (PARP) (b), Bcl‐xL (c), and tumor growth inhibition profiles (d) for four different vorinostat dosing regimens in LAGκ‐1B xenografts. Symbols represent data digitized from an original publication,24 and lines represent model simulated (protein biomarkers) or fitted (tumor volume) profiles (black = control; red = 60 mg/kg q.d. × 5 day dosing; green = 100 mg/kg q.d. × 5 day dosing; blue = 100 mg/kg q.d. × 2 day dosing; and pink = 300 mg/kg q.d. × 2 day dosing).
Initially, the modeling was conducted without threshold parameters; however, the model fits for the lower three dosing regimens were overpredicted. Threshold parameters were then introduced for p21 and cleaved PARP (proteins in which different dose levels displayed greater separation) which allowed for differences in signaling for the higher doses that were given less frequently (100 and 300 mg/kg q.d. × 2 day dosing). Figure 4 d shows the final model fits for tumor growth inhibition in mice. Overall, this approach reasonably captured the observed trends. All the system parameters, as well as the threshold parameters, were estimated with good precision (Table 2). The model estimated value for p21 and cleaved PARP threshold parameters were 11.6 and 3.26, which closely corresponded to their response peak for 300 mg/kg q.d. × 2 day dosing (highest dose). Interestingly, the ratios of the growth rate constant (kg) to the death rate constant (kd) for in vitro cell proliferation and in vivo tumor kinetics were found to be comparable (5.56 vs. 5.52).
Table 2.
Parameter estimates for tumor growth kinetics in LAGκ‐1β xenografts PARP, poly ADP‐ribose polymerase.
| Parameter | Unit | Definition | Estimate | CV% |
|---|---|---|---|---|
| kg | h−1 | Tumor growth rate constant | 0.00471 | 7.46 |
| kd | h−1 | Tumor death rate constant | 0.000854 | 30.9 |
| TV0 | mm3 | Initial tumor volume | 35.0 | 13.2 |
| p21_thresh | – | Threshold needed to elicit p21 effect | 11.6 | 3.96 |
| cl.PARP_thresh | – | Threshold needed to elicit PARP effect | 3.26 | 10.0 |
DISCUSSION
Vorinostat is a pan‐HDAC inhibitor that has multiple downstream effects in the cell cycle and apoptotic pathways.10 It has demonstrated efficacy in combination therapy with bortezomib, melphalan, and other agents for multiple myeloma in preclinical and clinical studies.8, 9, 11, 24 In this study, we present a mechanistic model‐based platform to evaluate the role of intracellular biomarkers in regulating the exposure‐response relationships of vorinostat in multiple myeloma and understand the concentration dependency of its effects.
Vorinostat concentrations were followed over time in vitro (Supplementary Figure S1) to obtain appropriate concentration drivers for signal transduction. Interestingly, vorinostat exhibited degradation, illustrating that often‐assumed static concentrations in vitro could be misrepresentative, and drug degradation in vitro should be considered while studying pharmacological effects. Two vorinostat concentrations were selected to study effects on in vitro signaling: 2 μM (peak plasma concentration in the clinic26) and 5 μM (a higher concentration at which signaling dynamics can be discerned effectively). Nonlinearity in responses (p21) were observed suggesting that like most PD systems, it is also critical to study biomarker changes for more than one concentration, especially to simulate outcomes under different conditions. The time‐course of cell proliferation in U266 cells exposed to 1 μM vorinostat was simulated using the final model‐estimated parameters (Table 1). The model predicted reasonably the overall response of vorinostat (Supplementary Figure S3) suggesting that the model can be applied to explore vorinostat effects at different concentrations.
Vorinostat induces upregulation of p53 and p53‐regulated genes,9, 10, 27 but as observed in our experiments, p53 shows an initial decrease followed by an increase around 24 hours (Figure 3 e). Degradation of mp53 has been related to inhibition of HDAC619 and HDAC820 enzymes by vorinostat. It has been proposed that inhibition of HDAC6 causes acetylation of Heat Shock Protein 90 (HSP90) leading to its subsequent inactivation. This results in release of mp53 from the HSP 90‐mp53 complex that is responsible for stability of mp53. Free mp53 then enables the reactivation of MDM2 and CHIP E3 ligases that trigger its degradation.19 Because U266 cells carry a mutant p53 allele,21 the decrease could be representative of the mp53 population and the latter increase could be wtp53, which is stimulated by other apoptotic effects of vorinostat (represented by stimulation of production of wtp53 by cleaved PARP). Vorinostat also causes apoptosis and a decrease in cellular proliferation irrespective of the mutational status of p53.28 This is in agreement with our results that show a decrease in cell viability regardless of wild and mutant type alleles of the U266 cell line (Figure 3 f). The p53 status of the patient‐derived LAGκ‐1β xenograft is unavailable from the study in which the data were extracted.24 However, results suggest that vorinostat could be a viable treatment strategy for tumors with a mutant p53. Initially, mp53 and wtp53 were treated as one population, with vorinostat inhibiting production and cleaved PARP inhibiting loss. However, this approach did not characterize the trends in p53 dynamics. Only after separation of mp53 and wtp53, with distinct turnover parameters, were the data described well. The cellular effects of mp53 were incorporated via its inhibition of cleaved PARP, reflecting the probable abrogation of wtp53 activity or its gain of function.29 Simulations suggest that cleaved PARP would be slightly decreased at later times if only mp53 is present, and the cleaved PARP profile would be muted substantially over the entire time‐course if only wt53 is present (data not shown). Testing the final model in a xenograft system with known p53 status would add value and could be used to inform and refine the computational model.
Vorinostat exposure in U266 cells causes marginal stimulation of NF‐κβ activity8 and upregulation of the BCL6 family of genes owing to nonhistone protein acetylation.10 Hence, there is a possibility that Bcl‐xL is downregulated regardless of the slight stimulation of NF‐κβ by vorinostat (Figure 3 c,d). Similar behavior has been reported in U266 cells treated with bortezomib, which was subsequently characterized by a precursor pool model for pNF‐κβ and stimulation of Bcl‐xL loss by cleaved PARP.18 A similar model structure was also tested in this study, but the nature of the data warranted (1) a transit compartment for pNF‐κβ without a precursor pool (i.e., no decrease observed for pNF‐κβ at later times), and (2) a direct inhibition of Bcl‐xL by vorinostat (as decrease in Bcl‐xL occurred prior to upregulation of cleaved PARP). Because IKK and Iκβ dynamics under vorinostat exposure were not measured in this study, more detailed NF‐κβ model structures incorporating oscillatory behavior30 were not explored, and the simplest model that captured the data reasonably well was applied.
The signaling model was also used to bridge vorinostat PK and PD in a murine xenograft system. Originally, tumor growth was driven by the fold‐changes in p21, cleaved PARP, and Bcl‐xL (Figure 1) using the parameter estimates from the in vitro signaling model directly. However, the model predicted complete inhibition of tumor volume for all dosing schedules without distinguishing responses among different dose levels. In contrast, the protein dynamics differed among the three dosing schedules (Figure 4), suggesting that there could be a potential threshold capacity for the signaling changes to elicit an ultimate effect on tumor volume. As p21 was the only protein in the model regulated by a nonlinear function, a threshold parameter for p21 was tested. However, the model did not properly capture the separation for the highest dose. Only on including a combination of thresholds for p21 and cleaved PARP simultaneously were all dosing regimens well captured. Notwithstanding other factors, such as tumor microenvironment interactions and use of only mean xenograft data (that could potentially obscure interindividual variability), the modulation opportunities offered by the signaling model are a unique feature that aid in explaining the observed lack of differences in efficacy of three dosing schedules and a strong effect at the highest dose concurrently. Traditional PK/PD tumor growth inhibition models, such as the cell distribution model by Simeoni et al.13 and a signal distribution (time‐dependent transduction) model by Lobo and Balthasar12 were unable to recapitulate the tumor growth profiles (Supplementary Figure S4a,b). The parameters were also estimated with poor precision (Supplementary Table S4). This further highlights the utility of the developed signaling model, which was able to capture complex tumor growth data that could not be explained by parsimonious PK/PD relationships.
There are certain limitations associated with this cellular model development and the subsequent translation to xenografts. The modulation of a majority of biomarkers in the model required a direct perturbation by vorinostat with delays imposed by empirical transit compartments. Inclusion of more upstream and intermediate signaling biomarkers, such as protein kinase B and caspases, could potentially minimize the use of direct vorinostat modulation and empirical functions. The developed model is for the U266 cell line, and further evaluation is needed with respect to conservation of model parameters and protein biomarker relationships across other multiple myeloma cell lines and xenograft systems. Interestingly, similar qualitative profiles were shown for p21 and p53 in another myeloma cell line (MM.1S) after vorinostat exposure.27 In addition, a different Bcl‐2 family protein (BID) showed an inhibition profile comparable to the time‐course of Bcl‐xL (Figure 3 c). This adds confidence in our experimental results and the potential of the final model to be extended to other cell myeloma cell types. Other factors can contribute to differences in signal transduction or the magnitude of protein expression and could affect the structural model. Despite these limitations, the signaling model offers a mechanism‐based description of vorinostat effects, provides for a biomarker driven in vitro‐in vivo translational approach, and serves as a platform for further testing and model extensions.
In summary, a mechanism‐based cellular PD model incorporating critical myeloma signaling proteins was developed and successfully applied to bridge vorinostat exposure‐response relationships for in vitro and in vivo multiple myeloma systems. Protein dynamics were linked to cell proliferation, and the signaling model was used as a translational platform to connect vorinostat PK and tumor growth inhibition in mice. The introduction of threshold parameters for biomarker modulation conferred the ability to capture complex tumor growth kinetics at different dose levels, which could not be achieved with traditional semimechanistic PK/PD models. Although the final cell model is specific to the U266 cell line, it can be extended to other multiple myeloma cell lines and other tumors that harbor similar signaling pathways. The model can also be translated to patient‐derived xenografts with slight modifications, and may hold promise for translation to clinical outcomes. Finally, the model also offers the prospect of a mechanism‐driven evaluation of vorinostat combination therapy in multiple myeloma.
Author Contributions
D.E.M. and C.N. wrote the manuscript. C.N. performed the research. D.E.M. and C.N. analyzed the data. D.R. contributed new reagents/analytical tools.
Conflict of Interest
As an associate editor for PSP, Donald E. Mager was not involved in the review or decision process for this article.
Supporting information
Supporting Information
Supplementary Figure S1 Vorinostat concentration‐time profile in Roswell Park Memorial Institute (RPMI) 1640 cell culture media. Symbols represent observed experimental data, and lines are model‐fitted profiles.
Supplementary Figure S2 Pharmacokinetic model fitting for 10 mg/kg i.v. bolus vorinostat in BALB/c mice. Symbols represent data digitized from an original publication,1 and lines represent model‐fitted profiles.
Supplementary Figure S3 Signaling model qualification with U266 cell proliferation at 1 μM vorinostat. Symbols represent observed experimental data, and lines are model‐simulated profiles.
Supplementary Figure S4 Model fittings for tumor growth kinetics in LAGκ‐1B xenografts using traditional tumor growth inhibition models. Model fittings using (a) the cell distribution model2 and (b) the signal distribution model.3 Symbols represent data digitized from an original publication,4 and lines are model‐fitted profiles.
Supplementary Table S1 parameter estimates for vorinostat degradation kinetics in Roswell Park Memorial Institute (RPMI) 1640 cell culture media.
Supplementary Table S2 Pharmacokinetic parameter estimates for vorinostat 10 mg/kg i.v. bolus in BALB/c mice.
Supplementary Table S3 Parameter estimates for tumor growth kinetics in LAGκ‐1B xenografts using traditional tumor growth inhibition models.
Supporting Information
References
- 1. Laubach, J. , Richardson, P. & Anderson, K. Multiple myeloma. Annu. Rev. Med. 62, 249–264 (2011). [DOI] [PubMed] [Google Scholar]
- 2. Palumbo, A. & Anderson, K. Multiple myeloma. N. Engl. J. Med. 364, 1046–1060 (2011). [DOI] [PubMed] [Google Scholar]
- 3. Oancea, M. , Mani, A. , Hussein, M.A. & Almasan, A. Apoptosis of multiple myeloma. Int. J. Hematol. 80, 224–231 (2004). [DOI] [PMC free article] [PubMed] [Google Scholar]
- 4. Borrello, I. Can we change the disease biology of multiple myeloma? Leuk. Res. 36 Suppl 1, S3–S12 (2012). [DOI] [PMC free article] [PubMed] [Google Scholar]
- 5. Kirouac, D.C. et al Computational modeling of ERBB2‐amplified breast cancer identifies combined ErbB2/3 blockade as superior to the combination of MEK and AKT inhibitors. Sci. Signal. 6, ra68 (2013). [DOI] [PubMed] [Google Scholar]
- 6. Hideshima, T. , Richardson, P.G. & Anderson, K.C. Mechanism of action of proteasome inhibitors and deacetylase inhibitors and the biological basis of synergy in multiple myeloma. Mol. Cancer Ther. 10, 2034–2042 (2011). [DOI] [PMC free article] [PubMed] [Google Scholar]
- 7. Nawrocki, S.T. et al Myc regulates aggresome formation, the induction of Noxa, and apoptosis in response to the combination of bortezomib and SAHA. Blood 112, 2917–2926 (2008). [DOI] [PMC free article] [PubMed] [Google Scholar]
- 8. Pei, X.Y. , Dai, Y. & Grant, S. Synergistic induction of oxidative injury and apoptosis in human multiple myeloma cells by the proteasome inhibitor bortezomib and histone deacetylase inhibitors. Clin. Cancer Res. 10, 3839–3852 (2004). [DOI] [PubMed] [Google Scholar]
- 9. Carew, J.S. , Giles, F.J. & Nawrocki, S.T. Histone deacetylase inhibitors: mechanisms of cell death and promise in combination cancer therapy. Cancer Lett. 269, 7–17 (2008). [DOI] [PubMed] [Google Scholar]
- 10. Richon, V.M. Cancer biology: mechanism of antitumour action of vorinostat (suberoylanilide hydroxamic acid), a novel histone deacetylase inhibitor. Br. J. Cancer 95 (Suppl 1), S2–S6 (2006). [Google Scholar]
- 11. Dimopoulos, M. et al Vorinostat or placebo in combination with bortezomib in patients with multiple myeloma (VANTAGE 088): a multicentre, randomised, double‐blind study. Lancet Oncol. 14, 1129–1140 (2013). [DOI] [PubMed] [Google Scholar]
- 12. Lobo, E.D. & Balthasar, J.P. Pharmacodynamic modeling of chemotherapeutic effects: application of a transit compartment model to characterize methotrexate effects in vitro. AAPS PharmSci. 4, E42 (2002). [DOI] [PMC free article] [PubMed] [Google Scholar]
- 13. Simeoni, M. et al Predictive pharmacokinetic‐pharmacodynamic modeling of tumor growth kinetics in xenograft models after administration of anticancer agents. Cancer Res. 64, 1094–1101 (2004). [DOI] [PubMed] [Google Scholar]
- 14. Nanavati, C. & Mager, D.E. Sequential exposure of bortezomib and vorinostat is synergistic in multiple myeloma cells. Pharm. Res. 34, 668–679 (2017). [DOI] [PMC free article] [PubMed] [Google Scholar]
- 15. Dayneka, N.L. , Garg, V. & Jusko, W.J. Comparison of four basic models of indirect pharmacodynamic responses. J. Pharmacokinet. Biopharm. 21, 457–478 (1993). [DOI] [PMC free article] [PubMed] [Google Scholar]
- 16. Mager, D.E. & Jusko, W.J. Pharmacodynamic modeling of time‐dependent transduction systems. Clin. Pharmacol. Ther. 70, 210–216 (2001). [DOI] [PubMed] [Google Scholar]
- 17. Hill, A.V. The possible effects of the aggregation of the molecules of haemoglobin on its oxygen dissociation curve. J. Physiol. 40, 4–7 (1910). [Google Scholar]
- 18. Chudasama, V.L. , Ovacik, M.A. , Abernethy, D.R. & Mager, D.E. Logic‐based and cellular pharmacodynamic modeling of bortezomib responses in U266 human myeloma cells. J. Pharmacol. Exp. Ther. 354, 448–458 (2015). [DOI] [PMC free article] [PubMed] [Google Scholar]
- 19. Li, D. , Marchenko, N.D. & Moll, U.M. SAHA shows preferential cytotoxicity in mutant p53 cancer cells by destabilizing mutant p53 through inhibition of the HDAC6‐Hsp90 chaperone axis. Cell Death Differ. 18, 1904–1913 (2011). [DOI] [PMC free article] [PubMed] [Google Scholar]
- 20. Yan, W. et al Histone deacetylase inhibitors suppress mutant p53 transcription via histone deacetylase 8. Oncogene 32, 599–609 (2013). [DOI] [PMC free article] [PubMed] [Google Scholar]
- 21. Mazars, G.R. et al Mutations of the p53 gene in human myeloma cell lines. Oncogene 7, 1015–1018 (1992). [PubMed] [Google Scholar]
- 22. Lindemann, R.K. et al Analysis of the apoptotic and therapeutic activities of histone deacetylase inhibitors by using a mouse model of B cell lymphoma. Proc. Natl. Acad. Sci. USA 104, 8071–8076 (2007). [DOI] [PMC free article] [PubMed] [Google Scholar]
- 23. Yeo, P. et al Development and validation of high‐performance liquid chromatography‐tandem mass spectrometry assay for 6‐(3‐benzoyl‐ureido)‐hexanoic acid hydroxyamide, a novel HDAC inhibitor, in mouse plasma for pharmacokinetic studies. Biomed. Chromatogr. 21, 184–189 (2007). [DOI] [PubMed] [Google Scholar]
- 24. Campbell, R.A. et al Vorinostat enhances the antimyeloma effects of melphalan and bortezomib. Eur. J. Haematol. 84, 201–211 (2010). [DOI] [PubMed] [Google Scholar]
- 25. D'Argenio, D.Z. , Schumitzky, A. & Wang, X. ADAPT 5 User's Guide: Pharmacokinetic/Pharmacodynamic Systems Analysis Software (Biomedical Simulations Resource, Los Angeles, CA, 2009).
- 26. Iwamoto, M. , Friedman, E.J. , Sandhu, P. , Agrawal, N.G. , Rubin, E.H. & Wagner, J.A. Clinical pharmacology profile of vorinostat, a histone deacetylase inhibitor. Cancer Chemother. Pharmacol. 72, 493–508 (2013). [DOI] [PubMed] [Google Scholar]
- 27. Mitsiades, N. et al Molecular sequelae of histone deacetylase inhibition in human malignant B cells. Blood 101, 4055–4062 (2003). [DOI] [PubMed] [Google Scholar]
- 28. Sonnemann, J. et al p53‐dependent and p53‐independent anticancer effects of different histone deacetylase inhibitors. Br. J. Cancer 110, 656–667 (2014). [DOI] [PMC free article] [PubMed] [Google Scholar]
- 29. Freed‐Pastor, W.A. & Prives, C. Mutant p53: one name, many proteins. Genes Dev. 26, 1268–1286 (2012). [DOI] [PMC free article] [PubMed] [Google Scholar]
- 30. Hoffmann, A. , Levchenko, A. , Scott, M.L. & Baltimore, D. The IkappaB‐NF‐kappaB signaling module: temporal control and selective gene activation. Science 298, 1241–1245 (2002). [DOI] [PubMed] [Google Scholar]
Associated Data
This section collects any data citations, data availability statements, or supplementary materials included in this article.
Supplementary Materials
Supporting Information
Supplementary Figure S1 Vorinostat concentration‐time profile in Roswell Park Memorial Institute (RPMI) 1640 cell culture media. Symbols represent observed experimental data, and lines are model‐fitted profiles.
Supplementary Figure S2 Pharmacokinetic model fitting for 10 mg/kg i.v. bolus vorinostat in BALB/c mice. Symbols represent data digitized from an original publication,1 and lines represent model‐fitted profiles.
Supplementary Figure S3 Signaling model qualification with U266 cell proliferation at 1 μM vorinostat. Symbols represent observed experimental data, and lines are model‐simulated profiles.
Supplementary Figure S4 Model fittings for tumor growth kinetics in LAGκ‐1B xenografts using traditional tumor growth inhibition models. Model fittings using (a) the cell distribution model2 and (b) the signal distribution model.3 Symbols represent data digitized from an original publication,4 and lines are model‐fitted profiles.
Supplementary Table S1 parameter estimates for vorinostat degradation kinetics in Roswell Park Memorial Institute (RPMI) 1640 cell culture media.
Supplementary Table S2 Pharmacokinetic parameter estimates for vorinostat 10 mg/kg i.v. bolus in BALB/c mice.
Supplementary Table S3 Parameter estimates for tumor growth kinetics in LAGκ‐1B xenografts using traditional tumor growth inhibition models.
Supporting Information