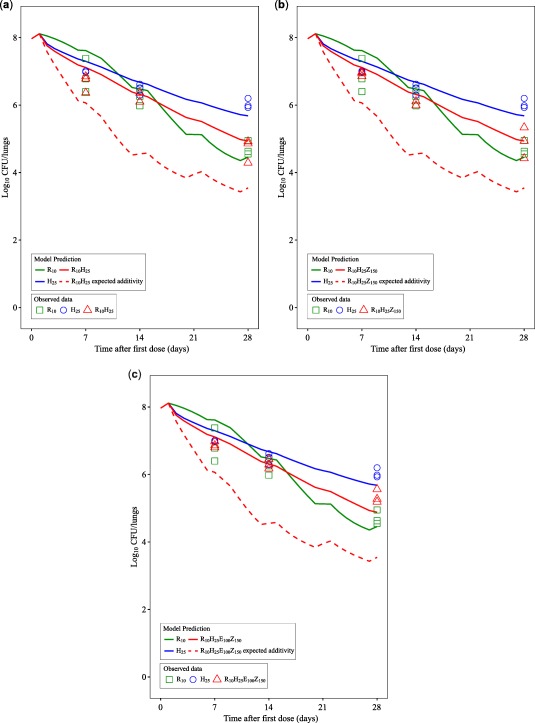
Figure 2.

Predicted change from baseline of log10 colony‐forming unit (CFU)/lungs after mono and combination therapies based on the final Multistate Tuberculosis Pharmacometric‐General Pharmacodynamic Interaction model (solid lines) compared to model‐predicted expected additivity (dotted lines) after 10 mg/kg rifampicin monotherapy (R10), 25 mg/kg isoniazid monotherapy (H25), combination therapy of 10 mg/kg rifampicin and 25 mg/kg isoniazid (R10H25), combination therapy of 10 mg/kg rifampicin, 25 mg/kg isoniazid, and 150 mg/kg pyrazinamide (R10H25Z150), combination therapy of 10 mg/kg rifampicin, 25 mg/kg isoniazid, 150 mg/kg pyrazinamide, and 100 mg/kg ethambutol (R10H25 Z150E100). Observed data are given as symbols. The data did not support any drug effect from pyrazinamide or ethambutol in monotherapy. The fluctuations in response are due to drug treatments in 5 of 7 days per week.
