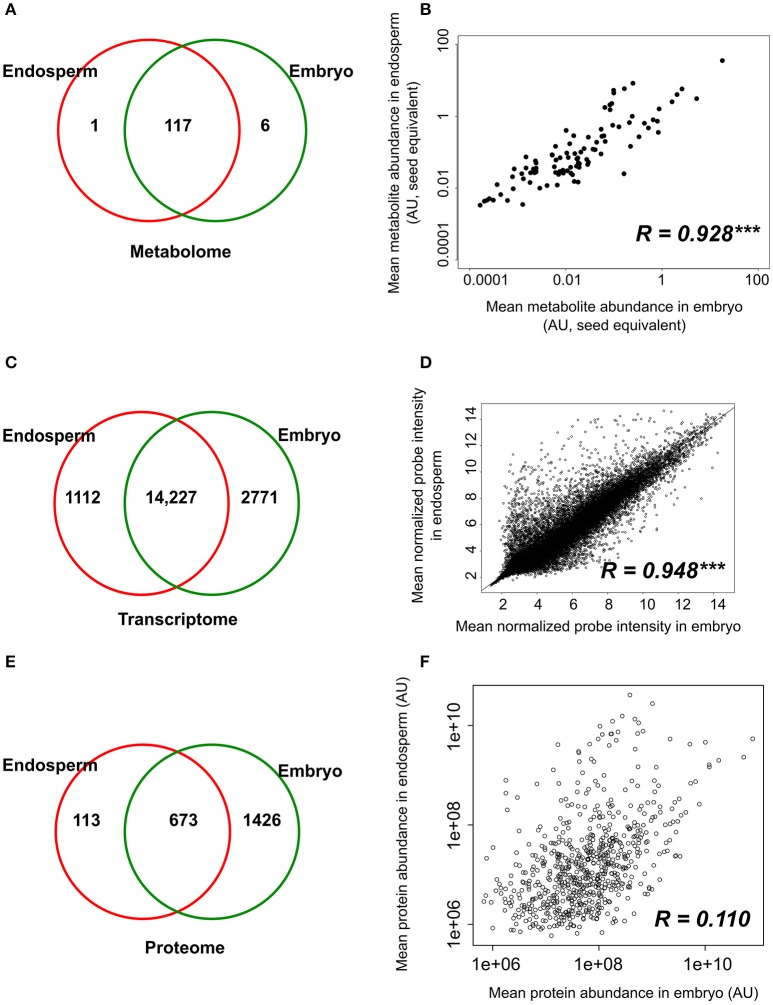
Figure 3.
Tissue-specificity and correlations between component tissue molecular apparatus. (A,C,E) Venn diagrams of the number of metabolites (A), probe sets (B), and proteins (C) detected in the dry embryo and endosperm. (B,D,F) Pearson correlations were calculated based on the metabolite level (B), probe signal (D) and protein abundance (F) in the embryo and endosperm. Protein and metabolites are plotted on a log2 and log10 scale respectively. Transcript (probe sets) intensities are log2 transformed during normalization and are plotted on non-transformed axis. Pearson correlation coefficients are indicated on each graph along with their significance level (***p < 0.001).

