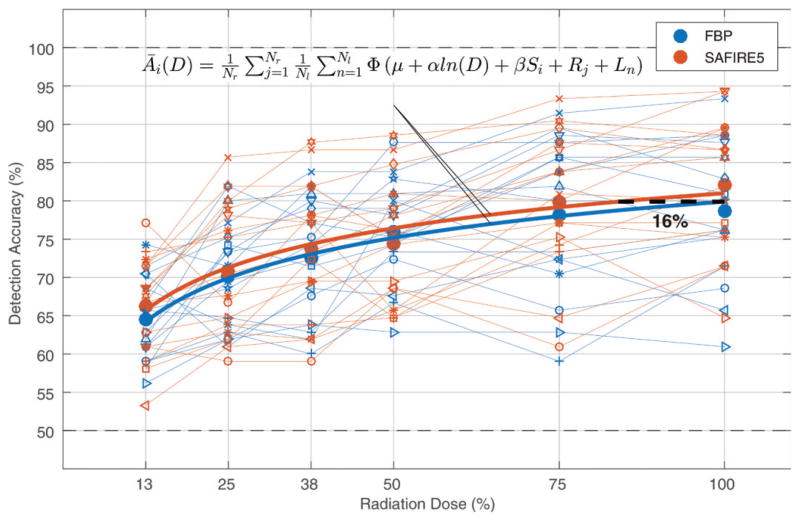
Figure 6.
Results of 2AFC detection experiment show detection accuracy as a function of radiation dose for FBP and SAFIRE. Small markers represent individual readers, large circles are average across readers, and thick solid lines represent detection accuracy averaged across readers and lesions as function of dose, Āi(D), as predicted by statistical model. Equation for Āi (D) is shown. Dashed line represents radiation dose reduction potential of SAFIRE.

