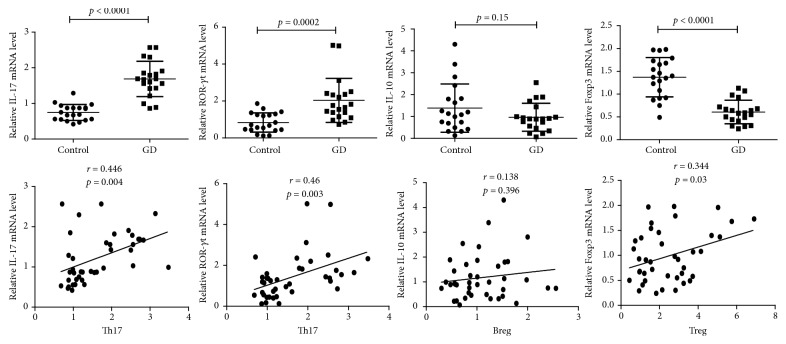
Figure 2.
Relative IL-17, ROR-γt, IL-10, and Foxp3 mRNA levels and their correlations with circulating Th17, Breg, and Treg cells in all participants. Total RNAs were extracted from PBMCs from participants' peripheral blood. Then the RNAs were reverse-transcribed into complementary DNA(cDNA) and the transcripts were quantified using real-time PCR System. The relative expression levels were determined by normalizing each target to GAPDH. The quantitative analysis of individual values was shown as mean ± SD. The correlation analysis was conducted using the Pearson correlation test. A p value < 0.05 was considered statistical difference.

