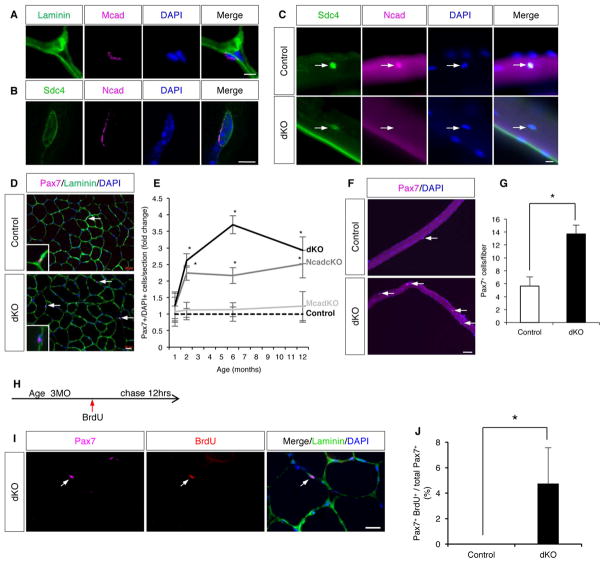
Figure 1. SC Quiescence is Broken in Ncad cKO and dKO Mice.
(A) IF of a TA section stained for Mcad and laminin.
(B) IF of a single EDL fiber stained for Ncad and the SC marker, Sdc4.
(C) IF of EDL fibers from control and dKO mice stained for Ncad and Sdc4. Arrows indicate SCs. See also Figure S1F–H.
(D) IF of TA sections from control and dKO mice stained for the SC marker Pax7 and the basal lamina marker Laminin. Arrows indicate SCs. Insets show higher magnification. See also Figure S1L–O.
(E) Quantification of Pax7+ SCs in TA sections over a 12-month (MO) time course. Ncad cKO and dKO mice are different from control and Mcad KO mice after 1MO.
(F) IF of EDL fibers from control and dKO mice. Arrows indicate SCs.
(G) Quantification of Pax+ SCs on EDL fibers at 6MO.
(H) BrdU dosage protocol.
(I) IF of a TA section from dKO mouse stained for Pax7, BrdU, and Laminin. Arrows indicate a Pax7+/BrdU+ SC.
(J) Quantification of Pax7+/BrdU+ SCs in TA sections from control and dKO mice.
Scale bars: (A, B) 5μm; (C) 10μm; (D, I) 20μm; (F) 50μm. *, p <0.05, means±SD.

