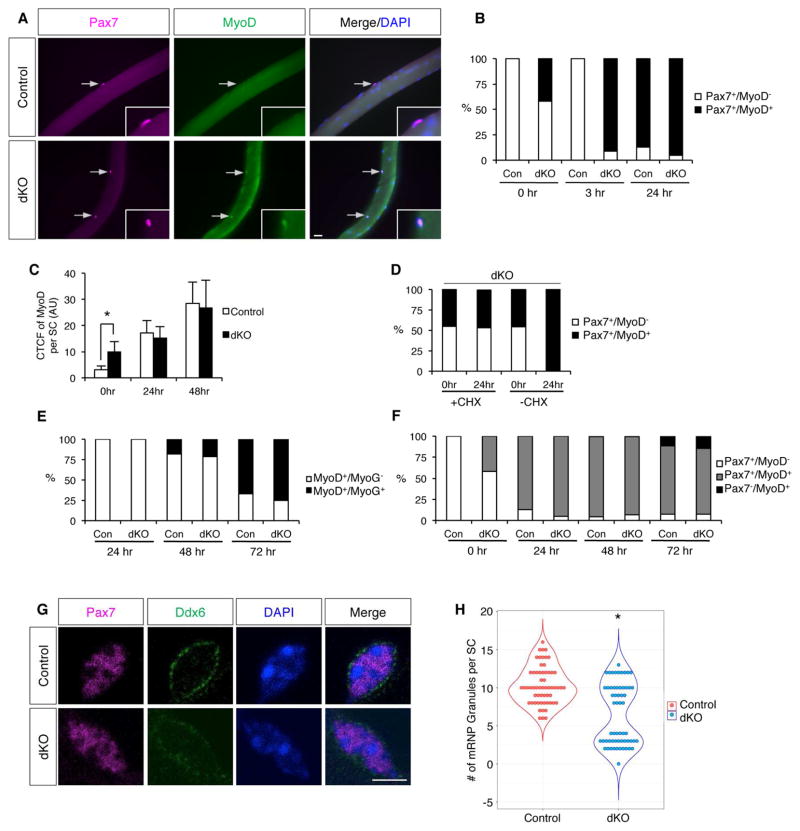
Figure 4. dKO SCs Display Properties of an Early State of Activation.
(A) IF of freshly isolated single EDL fibers from control and dKO mice stained for Pax7 and MyoD. Arrows indicate SCs. Insets, same SCs at higher magnification.
(B) Quantification of Pax7+/MyoD− and Pax7+/MyoD+ SCs on freshly isolated fibers (0hr), after 3hrs in collection buffer, and after 24hr of culture with CEE medium.
(C) Corrected total cell fluorescence (CTCF) of MyoD per SC on control and dKO fibers at 0hr, and after 24 and 48hrs of culture in CEE medium. AU, arbitrary units.
(D) Quantification of Pax7+/MyoD− and Pax7+/MyoD+ SCs on fibers from dKO mice at 0hr and after 24hrs of culture with CEE medium, ± cycloheximide (CHX).
(E) Quantification of MyoD+/MyoG− and MyoD+/MyoG+ cells on fibers from control and dKO mice after 24, 48, and 72hrs of culture with CEE medium. See also Figure S3D.
(F) Quantification of Pax7+/MyoD−, Pax7+/MyoD+ and Pax7−/MyoD+ cells on fibers from control and dKO mice at 0hrs and after 24, 48, and 72hrs of culture with CEE medium. See also Figure S3C.
(G) IF of Pax7 and Ddx6 in SCs on freshly isolated fibers from control and dKO mice.
(H) Beeswarm plot with violin plot overlaid of number of mRNP granules per SC in control and dKO mice. Scale bars: (A) 20μm; (G) 10μm. *, p<0.0001, means±SD.

