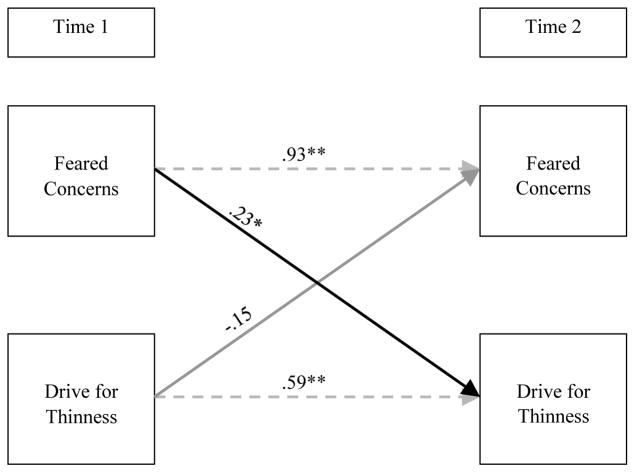
Figure 2. Feared concerns and drive for thinness across time.
Autoregressive relationships are light gray and dashed for clarity; Estimates on arrows represent standardized beta values. **p < .01, *p < .05. Time 1 = after discharge, Time 2 = one-month follow-up. Solid black arrows indicate significant relationships. Solid gray lines represent non-significant relationships.

