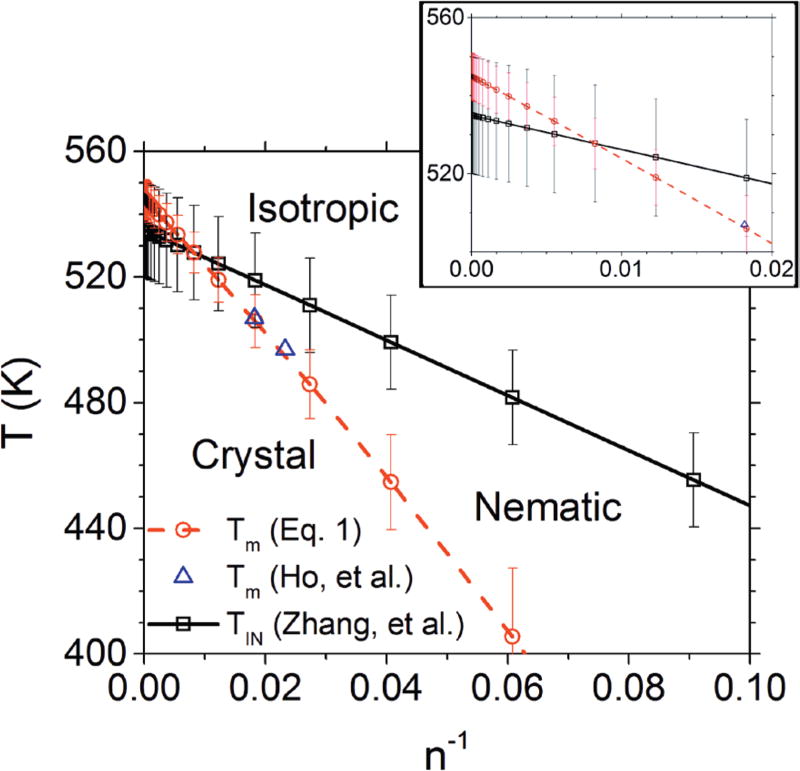
FIGURE 1.
(color online) P3HT phase diagram in terms of temperature T and number of repeat units n showing phase boundaries and stable thermodynamic states. The isotropic-nematic phase boundary was derived from Eq. 1. The Form I crystal melting data and line are from Eq. 2 with the parameters from Ref. 8. The error bars for TIN were taken from Ref. 2 and the error bars for Tm were obtained from the uncertainties in the fit parameters to Eq. 2. Triangles correspond to data from Ref. 3; the point for n=73 has been excluded because it is above the onset8 of chain folding. The inset shows an expanded view of the crossover region of the plot.

