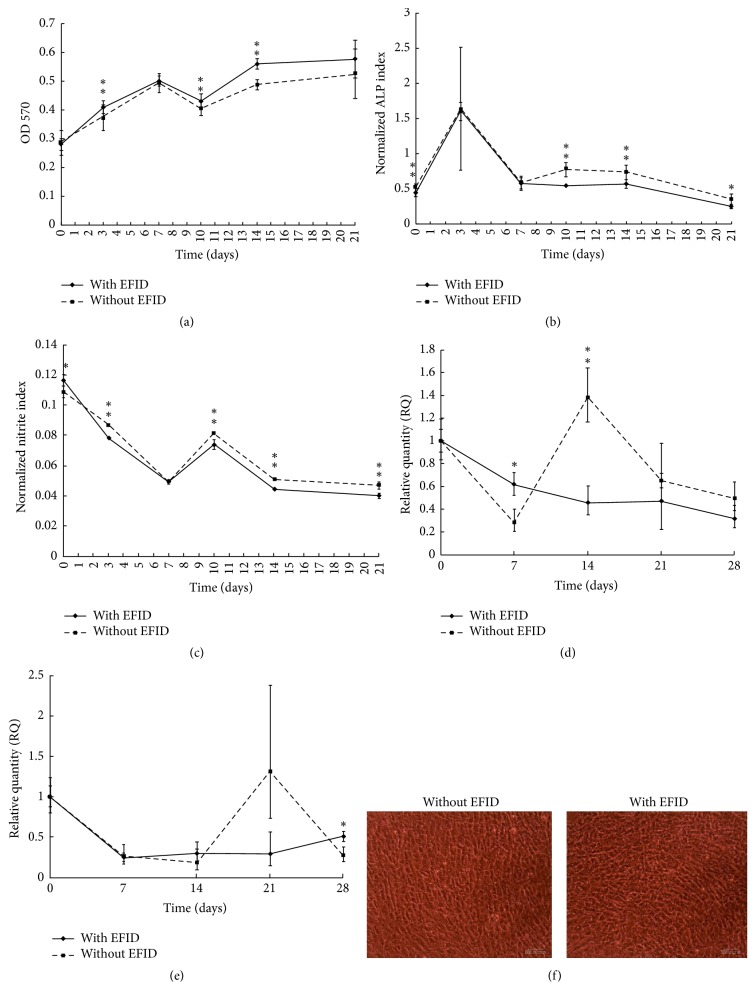
Figure 3.
(a) Overall cell viability with and without EFID stimulation at 1 × 10⁵ cells/well. (b) ALP production ability per cell with and without EFID stimulation at 1 × 10⁵ cells/well. (c) Nitrite production ability per cell per day with and without EFID stimulation at 1 × 10⁵ cells/well. (d) COL1A1 gene activity per cell with and without EFID stimulation at 1 × 10⁵ cells/well. (e) OCN gene activity per cell with and without EFID stimulation at 1 × 10⁵ cells/well. (f) Cell morphology at day 28 without (left) and with (right) EFID stimulation at 1 × 10⁵ cells/well. ∗P < 0.05 and ∗∗P < 0.005.

