Fig. 8.

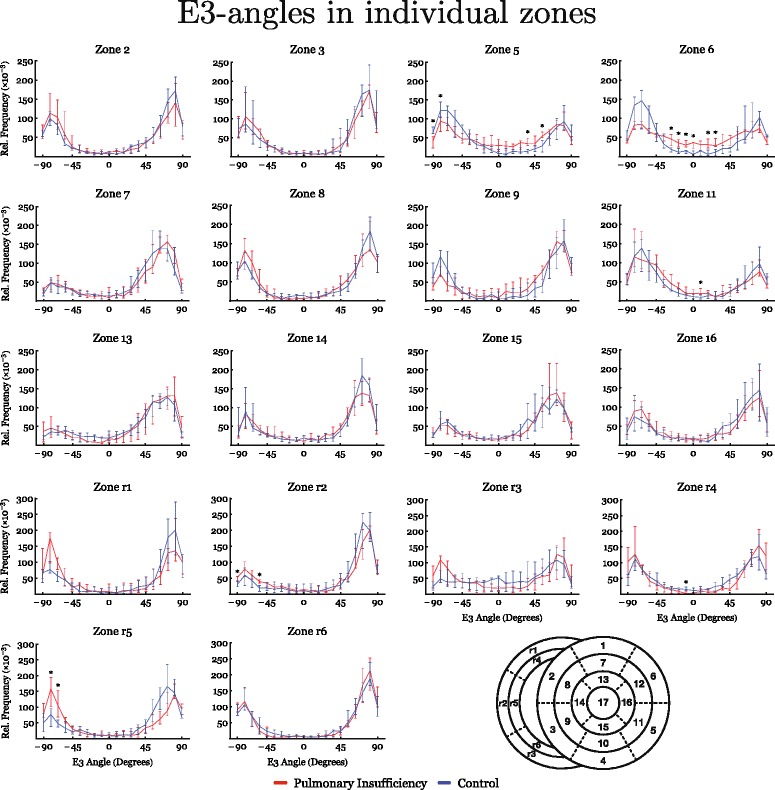
Regional analyses of E3-angles are shown in histograms. In the down right corner a schematic representation of the zones is presented for reference. Asterisk indicates statistical significance in individual areas using Mann-Whitney U-test

Regional analyses of E3-angles are shown in histograms. In the down right corner a schematic representation of the zones is presented for reference. Asterisk indicates statistical significance in individual areas using Mann-Whitney U-test