
Figure 5.
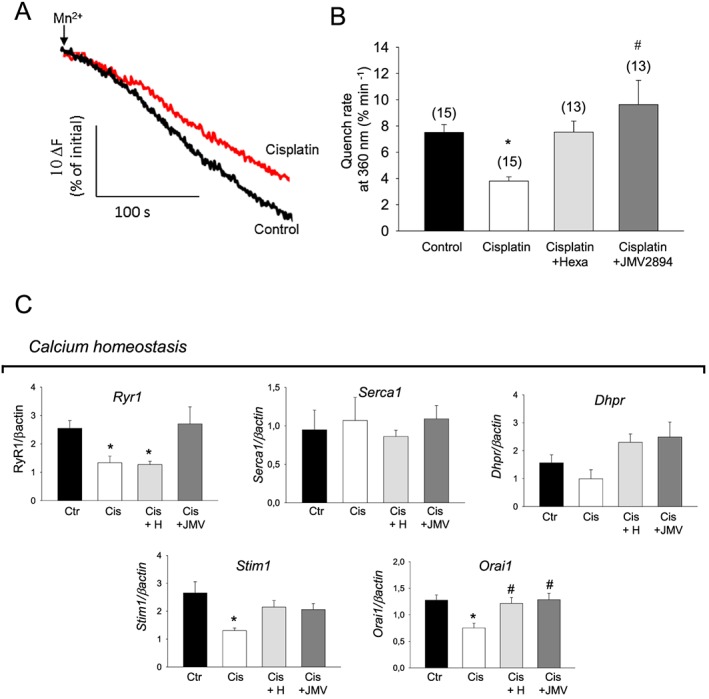
Effects of cisplatin and GHS treatments on SOCE properties and expression profile of genes related to calcium homeostasis. (A) Representative traces of fura‐2 fluorescence quenching associated with Mn2+ influx in skeletal muscle fibres following depletion of SR Ca2+ stores induced by thapsigargin and caffeine (see Methods). Arrows indicate the start of perfusion of muscle fibres with MnCl2 after fibres treatment with thapsigargin/caffeine in zero calcium. Black trace indicates muscle fibres from control rats and red trace from cisplatin treated rats; (B) mean quench rates after SOCE activation. Each bar represents the mean ± SEM of quench rates measured in n myofibers (n is indicated in the brackets) for each indicated group of rats from at least four animals. Statistical analysis by ANOVA showed significant differences (F = 6, df = 3/52 P < 0.02). Significantly different by Bonferroni's t‐test with respect to * control rats and # cisplatin treated rats (P < 0.05 or less). (C) Bars show quantification of transcript levels with qPCR for RyR1, Dhpr, ATP2A1, Stim1, Orai1 genes normalized by the β‐actin gene in EDL muscle from control rats, cisplatin, cisplatin + hexarelin and cisplatin + JMV2894 treated rats. For each gene, transcript levels were determined in EDL muscle of at least five animals for each group of rat. Significant differences between groups were evaluated using Kruskal–Wallis test and Mann–Whitney U test. Significant differences found with P < 0.05 or less are expressed with respect to * control rats, and # cisplatin treated rats. Ctr, control rats; Cis, cisplatin treated rats; Cis + H, cisplatin + hexarelin tretated rats; Cis + JMV, cisplatin + JMV2894 treated rats.