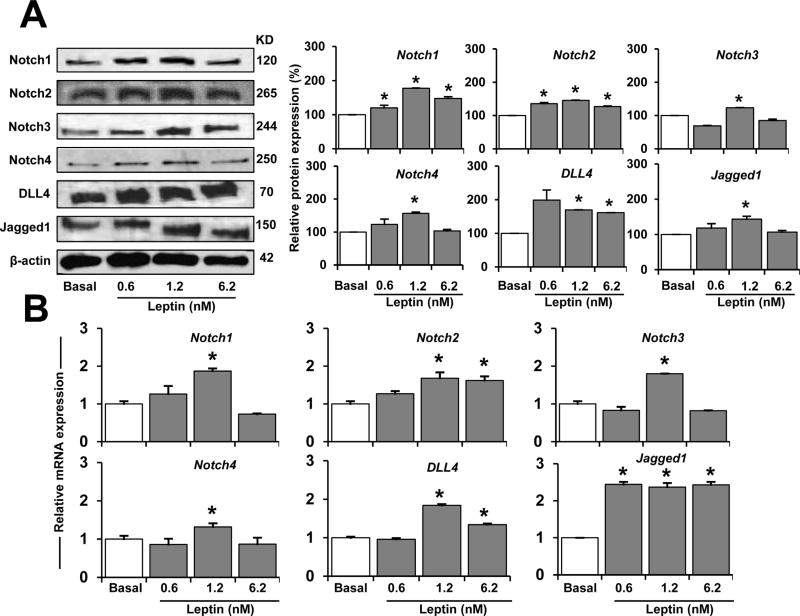
Fig. 2. Leptin dose-dependent induction of Notch protein and mRNA expression in endothelial cells.
A. Leptin dose-dependent induction of Notch proteins. Western blot representative results of leptin-induced Notch proteins in HUVEC. Cells were cultured in medium containing leptin (0.6,1.2, and 6.2 nM) for 24 h. Cell lysates were used to determine Notch protein expression after treatment. Beta-actin was used as a loading control. Histograms show densitometric analysis of protein expression normalized to beta-actin as determined using NIH image J software. Relative protein expression was calculated as percentage to basal. B. Leptin induction of Notch mRNA. Quantitative results from RT-PCR of Notch mRNA expression in HUVEC exposed to leptin as described in A. RNA expression was calculated by normalizing values to GAPDH mRNA. Relative mRNA expression was calculated to basal. Data is presented as an average ± s.d. from three independent experiments. * p < 0.05 when compared to basal.

