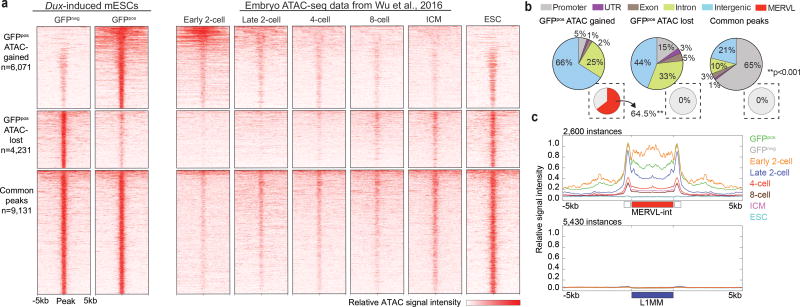
Figure 5. Dux-induced ‘2C-like’ cells acquire an open chromatin landscape that resembles an early 2-cell stage embryo.
(a) Heatmaps display regions of ATAC-seq signal gain, loss, and found in common between Dux-induced GFPpos and GFPneg cell populations [Two replicates per condition]. Dux-induced GFPpos cells acquire an open/closed chromatin landscape that resembles the early 2-cell stage embryo (Embryo ATAC-seq data from Wu et al., 2016). (b) Pie charts depicting the distribution of ATAC-seq gained, lost and common peaks at basic genomic features. Inset pie charts indicate the percentage of peaks that overlap with MERVL elements (MT2_Mm and MERVL-int) [Enrichment statistic determined empirically]. (c) Metagene analysis of ATAC-seq signal across all MERVL-int instances (top panel) and L1 instances (bottom panel) in Dux-induced GFPpos and GFPneg cells and the early embryo.

