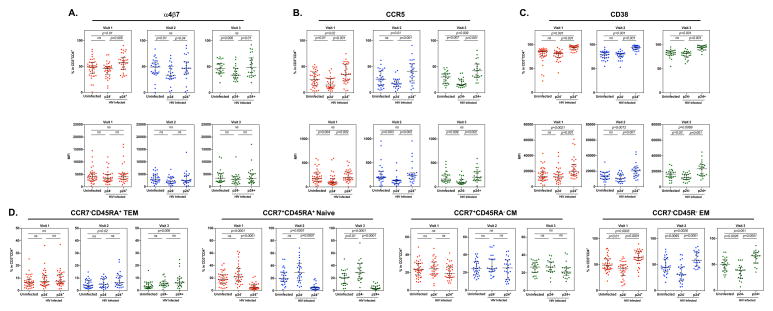
Figure 6. Immunological phenotypes of CD4+ T cells preferentially infected by HIV.
PBMCs exposed to HIV-1BaL (MOI 0.01) were cultured for 10 days. In HIV infected PBMCs, cell surface marker expression of integrin α4β7, CCR5, and CD38 cell surface marker expression (A–C) and T cell subsets (D) were measured on HIV p24−CD4+ T cells and HIV p24+CD4+ T cells. Uninfected cells were included as a comparison. Each dot represents one donor. Bars represent median and interquartile range. The Mann-Whitney test was used to compare cell surface marker expression between uninfected, HIV p24− or HIV p24+CD4+ T cells. p≤0.05 was considered significant, p>0.05 was not significant (ns).

