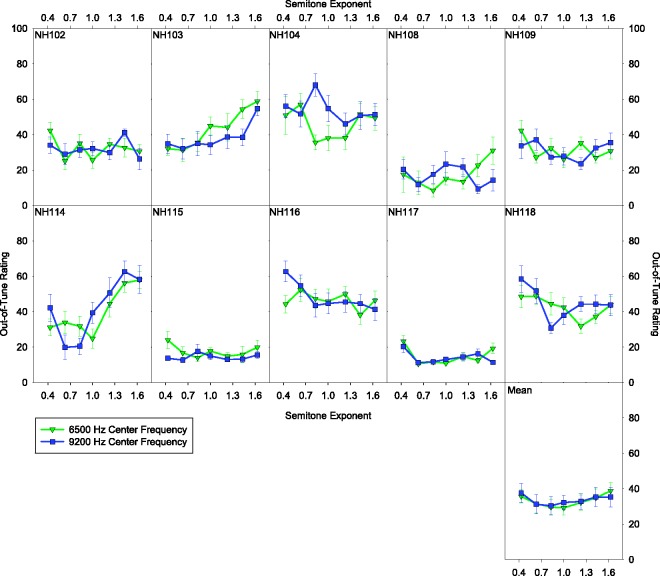
Figure 6.
Out-of-tune ratings as a function of semitone exponent for the acoustic pulsatile stimuli. Each panel shows ratings from an individual with NH. The bottom right panel shows the average ratings across listeners. Each shape and color indicates the center frequency of the stimuli. Error bars indicate ± 1 standard error of the mean.

