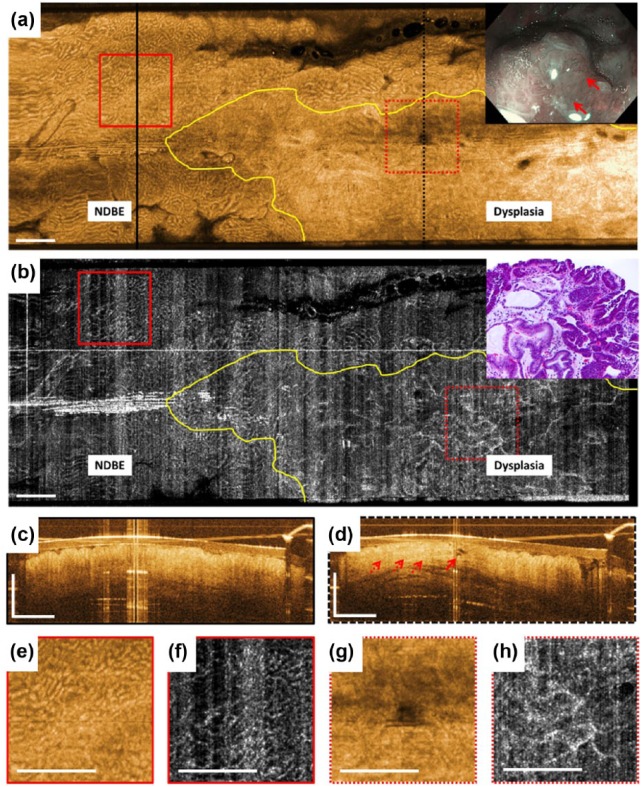
Figure 1.
Optical coherence tomography (OCT), OCT angiography (OCTA), and endoscopy images acquired prior to endoscopic mucosal resection (EMR). (a) This shows an en face OCT image and (b) shows an en face OCTA image at about 250 μm below the tissue surface. Yellow lines delineate the distal and one of the transverse lateral margins of the dysplastic lesion. (c) and (d) These show cross-sectional OCT images of the areas in black lines in (a). The solid red arrow in (d) points to atypical dilated glands and the dotted red arrows show atypical glandular architecture and higher surface than subsurface signal. (e), (f), (g), and (h) These show a two times zoom over the boxed areas in (a) and (b). The inset in (a) shows the corresponding white light endoscopy/narrow band imaging image prior to EMR. The solid red arrows point to the nodular lesion. The inset in (b) shows hematoxylin and eosin stained histology of the resected specimen. Scale bars are 1 mm. NDBE, non-dysplastic Barrett’s esophagus.

