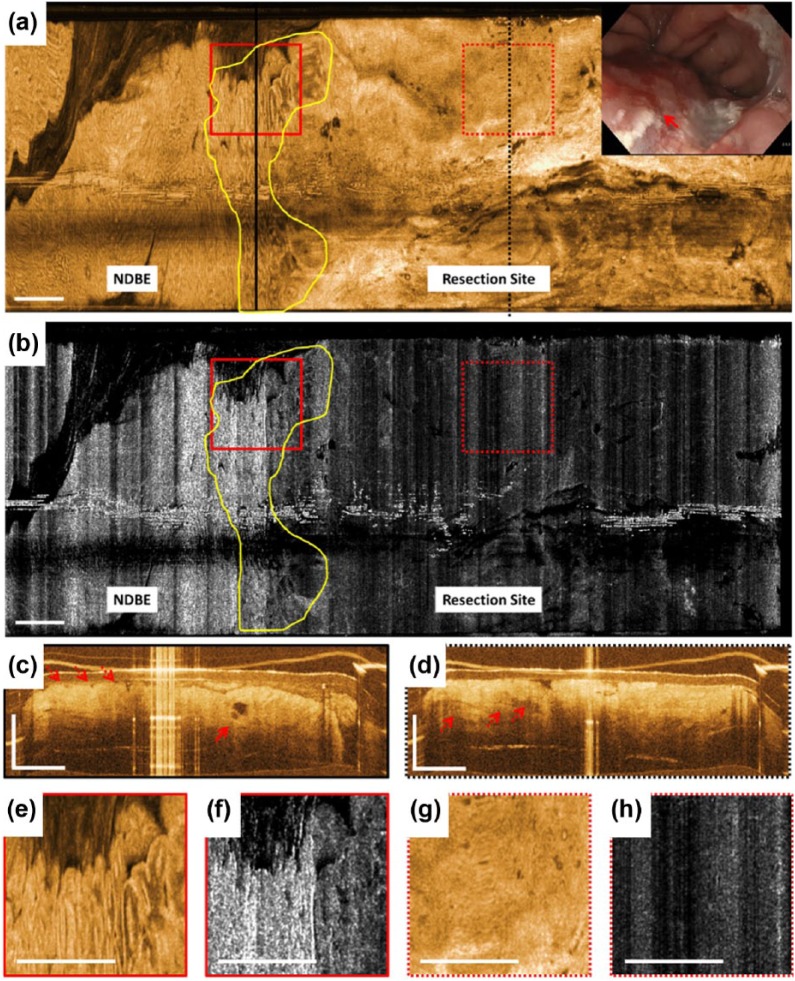
Figure 2.
Optical coherence tomography (OCT), OCT angiography (OCTA), and endoscopy images acquired immediately after endoscopic mucosal resection (EMR). (a) This shows an en face OCT image and (b) shows an en face OCTA image at about 250 μm below the tissue surface. Yellow lines mark an area with irregular mucosal patterns between the gastric/non-dysplastic Barrett’s esophagus (NDBE) region and the resection site suggesting a positive lateral margin and residual dysplasia. OCTA images of the gastric/NDBE region and lateral EMR margin exhibit high noise due to motion artifacts. (c) and (d) These show cross-sectional OCT images of the areas in black lines in (a). The solid red arrow in (c) points to atypical dilated glands and the dotted red arrows show atypical glandular architecture and irregular surface. The dotted red arrows in (d) show deep ductal/lymphatic structures at the resection site. (e), (f), (g), and (h) These show a two times zoom over the boxed areas in (a) and (b). The inset in (a) shows the corresponding white light endoscopy image immediately after EMR. The solid red arrow points to the resection site where endoscopic visibility is limited due to bleeding, debris, and cautery marks. Scale bars are 1 mm.

