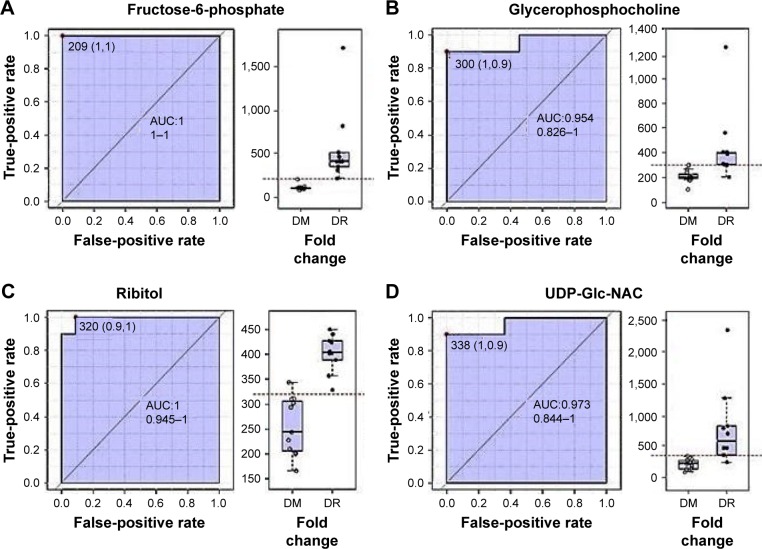
Figure 10.
ROC curve generated from the 1H-NMR spectral data to identify serum metabolomic biomarkers for neuroretinal degeneration.
Notes: (A) Fructose-6-phosphate, (B) glycerophosphocholine, (C) ribitol, (D) UDP-Glc-NAc of DM and DR, showing the fold change of metabolites, with sensitivity and specificity of classification model in discriminating between DM and DR.
Abbreviations: AUC, area under the curve; DM, diabetes mellitus; DR, diabetic retinopathy; NMR, nuclear magnetic resonance; ROC, receiver operating characteristic; UDP-Glc-NAc, uridine 5′-diphosphate-N-acetyl glucosamine.

