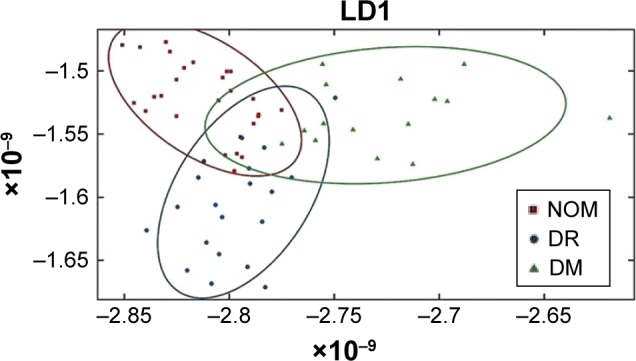
Figure 2.

LDA score plot of OCT intensity and textural features using 20 principal components after PCA–LDA, with the confidence ellipse representing confidence interval at 95%.
Abbreviations: DM, diabetes mellitus; DR, diabetic retinopathy; LDA, linear discriminant analysis; LD1, linear discriminant 1; NOM, normal; OCT, optical coherence tomography; PCA, principal component analysis.
