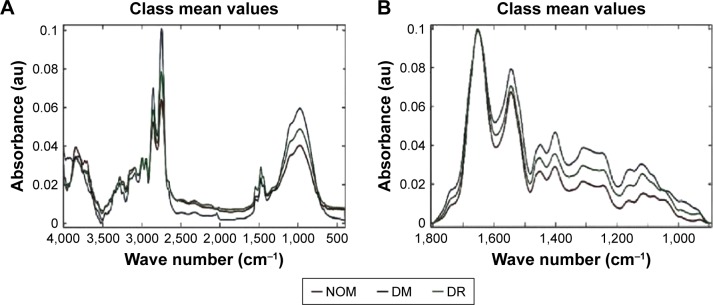
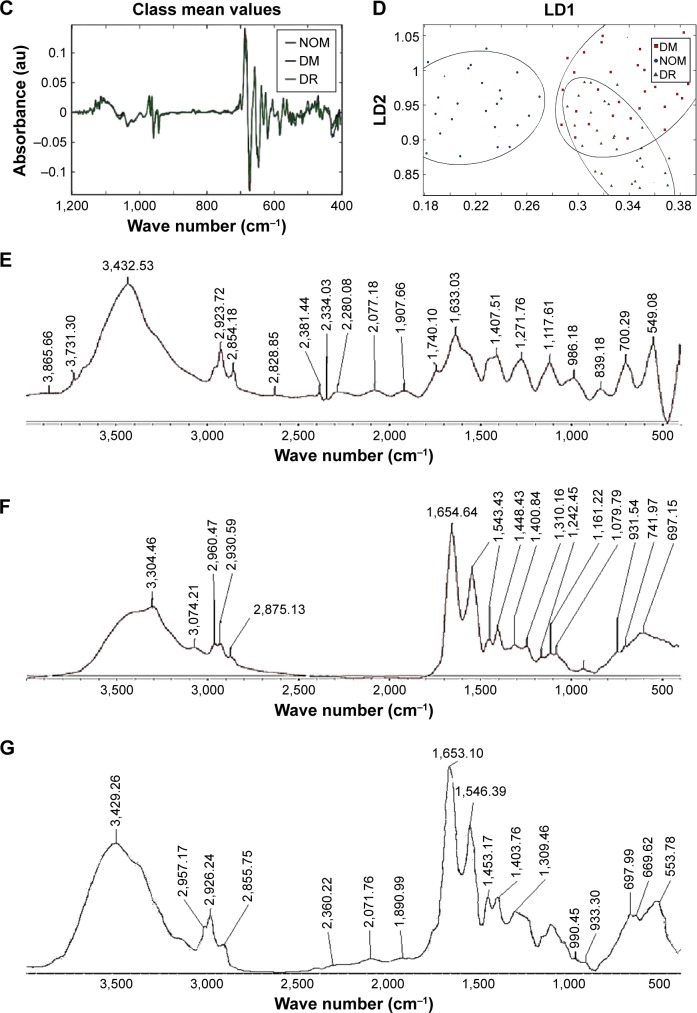
Figure 4.
Mean FTIR spectra of the whole region (400–4,000 cm−1).
Notes: (A) Mean spectra of the fingerprint region (900–1,800 cm−1) after RBBC; (B) mean spectra of the region between 400 and 1,200 cm–1 after RBBC, maximum vector normalization, followed by Savitzky–Golay differentiation of the first derivative spectra of NOM, DM, and DR; (C) LDA score plot of preprocessed spectra after mean centering and (D) PCA–LDA with confidence ellipse representing confidence interval at 95%. Mean spectra of the whole region for all conditions: (E) NOM, (F) DM, and (G) DR.
Abbreviations: au, arbitrary unit; DM, diabetes mellitus; DR, diabetic retinopathy; FTIR, Fourier transform infrared; LDA, linear discriminant analysis; LD1, linear discriminant 1; LD2, linear discriminant 2; NOM, normal; PCA, principal component analysis; RBBC, rubber band-like baseline correction.


