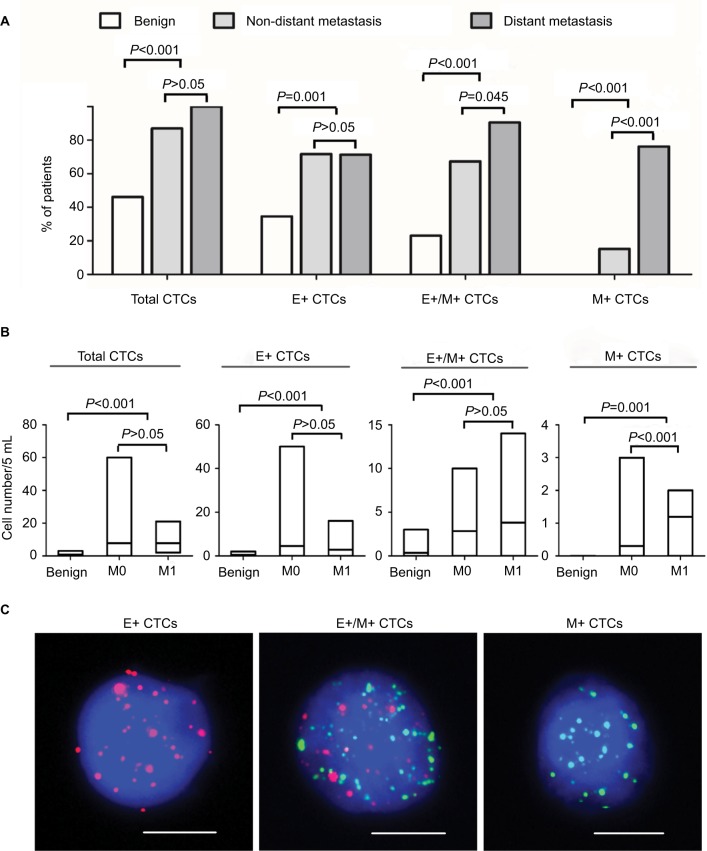
Figure 2.
Analysis of CTCs in blood samples from patients with benign breast disease and breast cancer with or without distant metastasis.
Notes: (A) Bar graphs represent percentage of breast cancer patients with or without distant metastasis and benign breast disease that show total, E+, E+/M+ and M+ CTCs. (B) The bar graphs show number of total, E+, E+/M+ and M+ CTCs in benign breast disease patients and breast cancer patients with or without distant metastasis. M0 denotes non-distant metastasis, whereas M1 denotes distant metastasis. The lines inside the bars denote the mean values. (C) Representative fluorescence images show RNA in situ hybridization of E+, E+/M+ and M+ CTCs. Scale bars =10 µm.
Abbreviations: CTC, circulating tumor cells; E+ CTCs, exclusively epithelial CTCs; E+/M+ CTCs, biphenotypic epithelial/mesenchymal CTCs; M+ CTCs, exclusively mesenchymal CTCs.

