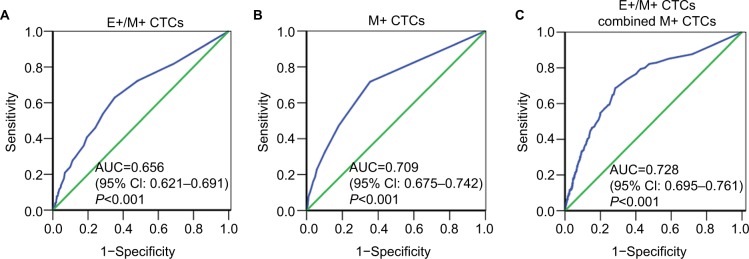
Figure 5.
ROC curve analysis of different CTC subsets in a large cohort of breast cancer patients.
Notes: (A–C) ROC curves for (A) E+/M+, (B) M+ and (C) E+/M+ plus M+ CTCs in the large cohort of breast cancer patients are shown. The AUC values show the ability of these CTCs to predict distant metastasis in breast cancer patients.
Abbreviations: AUC, area under the curve; CTCs, circulating tumor cells; ROC, receiver operating characteristic; E+ CTCs, exclusively epithelial CTCs; E+/M+ CTCs, biphenotypic epithelial/mesenchymal CTCs; M+ CTCs, exclusively mesenchymal CTCs.

