
FIGURE 1.
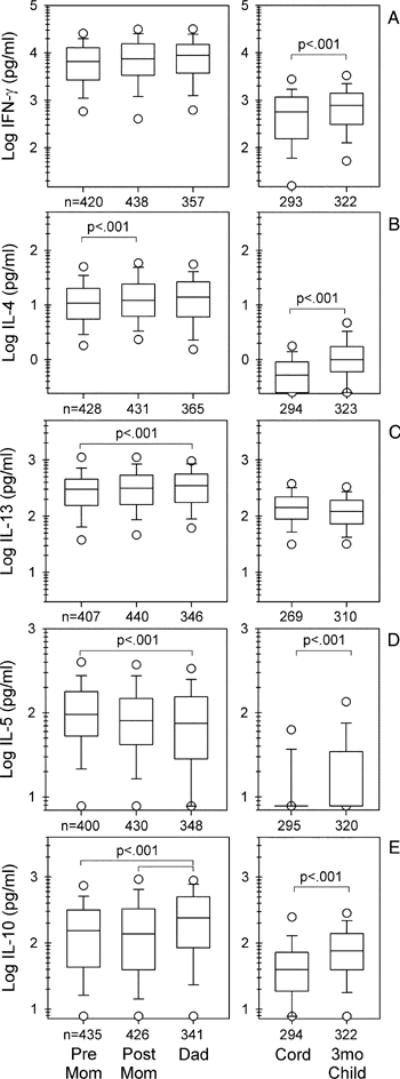
Cytokine production from mitogen-stimulated blood mononuclear cells of parents and infants. Although most data sets displayed are continuous and approximate log normal distributions, to maintain consistency throughout, data are shown as box plots, with boxes indicating 25–75% of values, lines within boxes indicating medians, whiskers 5 and 95% of values, and values beyond the whiskers as open symbols. Statistical comparisons shown for the two samples from mothers (pre mom and post mom) for all cytokines and the two samples from the infants (cord and 3-mo child) for IFN-γ, IL-13, and IL-10 were analyzed by random effects (by time). Pre-mom-to-dad and post-mom-to-dad comparisons were analyzed by Student’s t test. Wide brackets refer to pre-mom-to-dad comparisons. Value of p in E applies to both brackets. Cord-to-3-mo-child IL-4 and IL-5 comparisons were assessed (as percent detectable) by χ2. Pre Mom, Maternal prepartum samples; Post Mom, maternal postpartum samples; Dad, paternal samples; Cord, venous umbilical cord sample; 3mo Child, infant samples obtained at 3 mo of age.