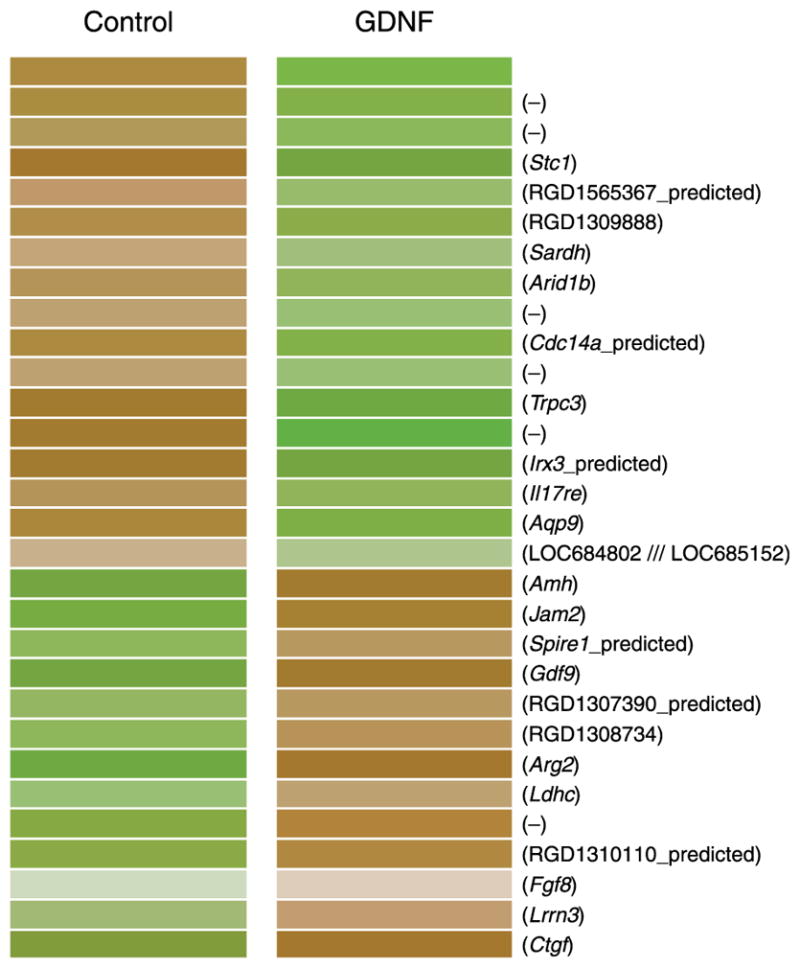
Figure 9.

Microarray of control and GDNF-treated postnatal day 4 rat ovaries after 2 days of culture. Dendrogram shows transcripts that increased (brown) or decreased (green) in GDNF-treated versus control ovaries. Gene symbols provided for each altered expression with (−) indicating an EST.
