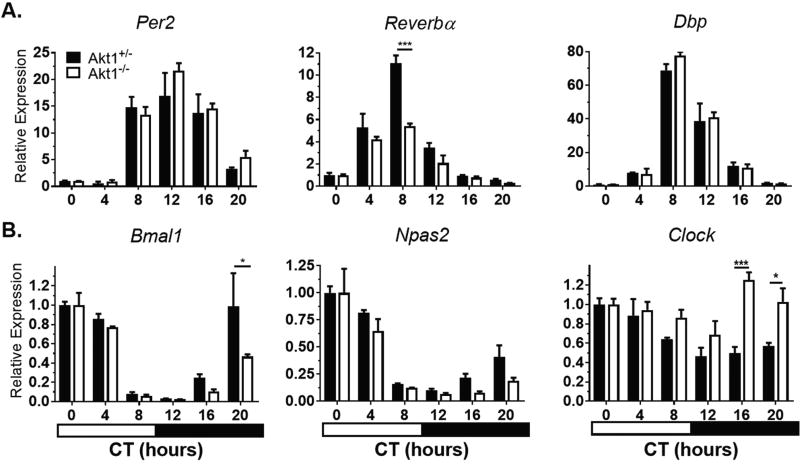
Figure 1.
Circadian gene expression in Akt1−/− hearts. Mice were sacrificed at the given times in complete darkness. Negative regulators (A) and positive regulators (B) of circadian rhythms were quantified by qPCR and gene expression normalized to Gapdh expression and CT0 (0700 h). Black bars, Akt1+/−. White bars, Akt1−/−. Horizontal black and white bar shows subjective dark and light phases of circadian time. Data are represented by mean ± SEM. n = 3; ***p < 0.001, *p < 0.05.

