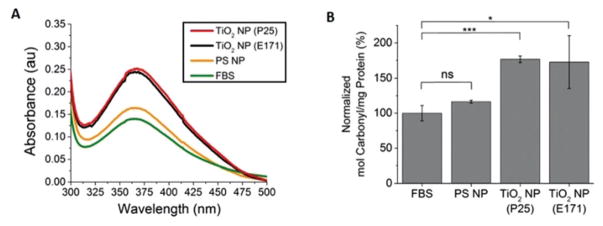
Fig. 2.
TiO2 NP-induced oxidation of serum proteins. (A) Absorption spectra of FBS alone (green) or FBS incubated with TiO2 NPs (P25 NPs are red, E171 NPs are black) and polystyrene (PS) NPs (orange) in the dark and then tagged with carbonyl-reactive DNPH. (B) The ratio of the 370 nm peak (DNPH) to the 280 nm peak (protein) quantifies the extent of oxidation. Error bars denote ± standard deviation for n = 3. ***p < 0.001, *p < 0.05, ns = non-significant. A comparison of the TiO2 NPs to the PS NPs has the same significance values as the TiO2 NPs to FBS.

