Fig. 4.
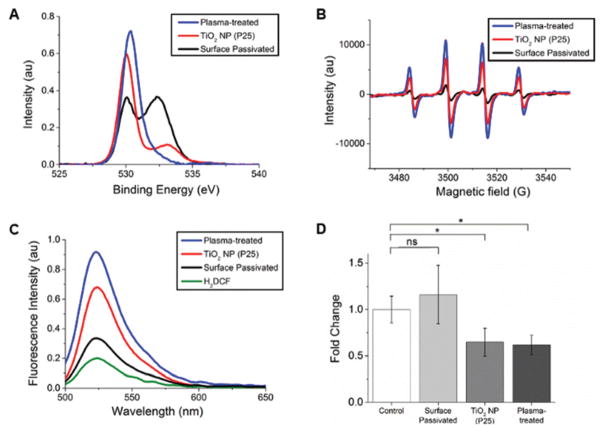
Increased or decreased surface defects correlate with ROS generation and oxidative stress. (A) XPS of untreated (red), plasma-treated (blue), and surface passivated (black) TiO2 NPs was used to monitor changes in oxygen vacancies in response to surface modification. Binding energies and peak areas are listed in Table S1.† (B) EPR spectra of control and surface-modified TiO2 NPs (10 mg mL−1) with DMPO (0.02 M). The TiO2 NP spectrum is replotted from Fig. 1 for comparison. (C) Fluorescence spectra of H2DCF (5 μM) in response to ROS. All TiO2 NPs (400 μg mL−1) were incubated with H2DCF in the dark (1 h, RT). Auto-oxidation of H2DCF (5 μM, green) results in a small positive signal. (D) Western blots were used to quantify changes in cellular oxidative stress as a function of surface modification of TiO2 NPs. The control shows cells incubated with standard cell culture media (MEM + 10% FBS). Experiments were carried out in triplicate. A representative western blot is shown in Fig. S5A.†

