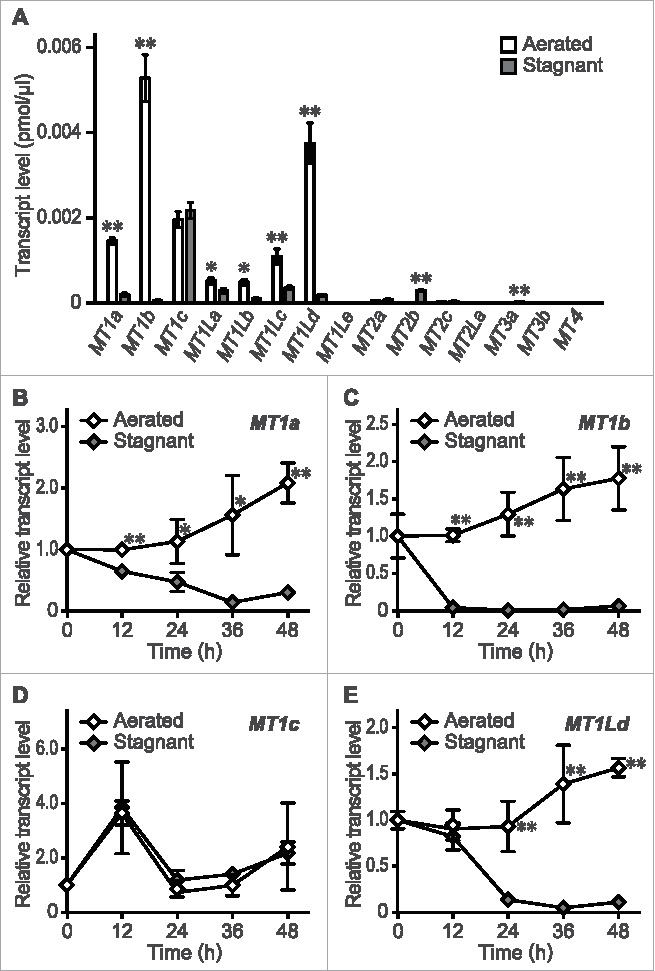
Figure 2.

Expression of MT genes in rice roots during aerenchyma formation. (A) Absolute transcript levels of MT genes at 10 mm (± 2 mm) from the tips of adventitious roots of rice seedlings grown under aerated or stagnant conditions for 36 h. (B-E) Time-course relative transcript levels of MT1a (B), MT1b (C), MT1c (D), and MT1Ld (E) at 10 mm (± 2 mm) from the root tips under aerated or stagnant conditions. The 20 to 40 mm roots of the 10-d-old aerobically grown rice seedlings were subjected to the treatments. The gene encoding transcription initiation factor IIE, TFIIE, was used as a control. Values are means ± SD (n = 3). Significant differences between aerated and stagnant conditions at P < 0.01 and P < 0.05 (two sample t test) are denoted by ** and *, respectively. The methods are described in more detail by Yamauchi and colleagues.13
