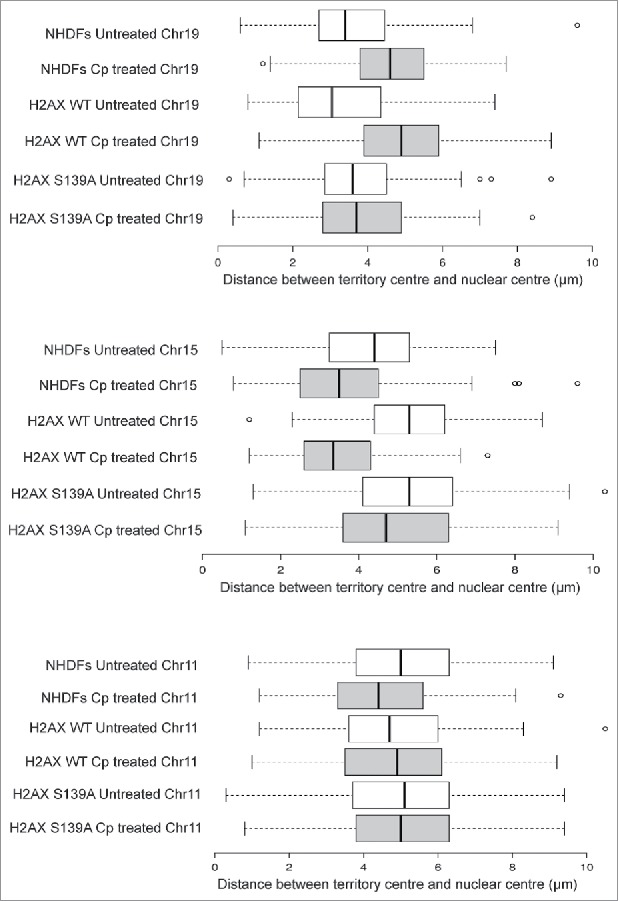
Figure 3.

Chromosome territory repositioning requires γH2AX signaling. The box plots were generated from experimentally derived frequency distributions of CT positions between the nuclear center and CT center in 3D confocal images (63x magnification), quantitated using Imaris software (N = 2, n = at least 30 nuclei). Adapted by permission from Oxford University Press: reference 25, copyright 2016. Only top 2-sets among CT19 and CT15 boxplots represented frequency distributions where the differences between treated and untreated samples were statistically significant (P < 0.05 and P < 0.01 as shown in Fig. 3, reference 25).
