Figure 7.

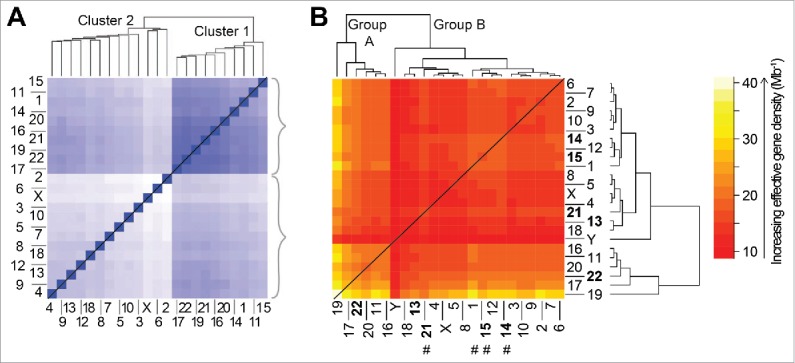
Comparison of the hierarchical organization for genome-level data generated independently from experiment (A) and theory (B). (A) Population-based analysis of Tethered Conformation Capture (TCC) Hi-C results,38 from the (46,X,X) diploid human nucleus, for chromosome territory localizations. Clustering of CTs was generated with respect to the average distance between the center of mass of a CT pair in the genome from the population of cells. The TCC Hi-C clustering dendrogram is shown on top and a matrix of the average distances between CT pairs is shown at the bottom. The darker blue shade signifies proximal genomic loci signifying closer contacts in space and therefore the intensity (of shade) changes inversely with the distance of separation between loci. Panel adapted by permission from Macmillan Publishers Ltd: reference 38, copyright 2012. (B) The hierarchical clustering of effective gene density elements from the effective gene density matrix that is generated for the diploid human male genome (46,X,Y). The 5 CTs associated with the Nucleolar Organizing Region are represented in bold. Four CTs that do not concur with “cluster 1” in panel A are highlighted using hash (#) in panel B.
