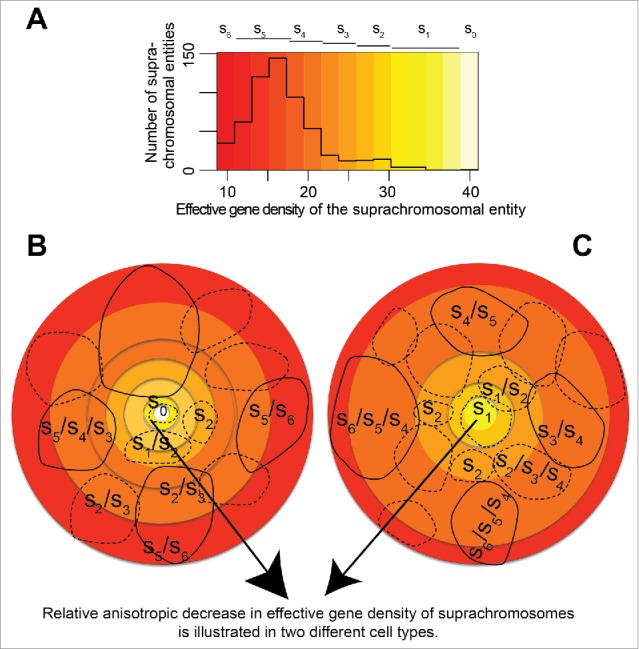
Figure 8.

(A) schematic representing distinct CT positioning in the (46,X,Y) diploid human nuclei. (A) The effective gene density distribution from CT pairs is represented in a histogram using off-white color (s0 – highest effective gene density) to red color (s6 – lowest effective gene density). All pairs of chromosomal entities (suprachromosomal units), which were derived from the human genome represent the histogram in panel A. Lighter colored hues, from off-white to yellow, represent a shallow pool of degenerate suprachromosomal entities. However, deeper hues, from orange to red, represent progressively larger pools of degenerate suprachromosomal units with similar effective gene density. (B, C) Cartoons of 2 human nuclei, rendered in 2D, represent the plasticity of a hypothetical arrangement of those suprachromosomal entities. The cohorts of suprachromosomal entities s0 – s6 may be used to recreate different CT constellations in cell type-specific or a clonal population of human nuclei. As mandated by a hypothetical boundary condition, where suprachromosomal units are arranged with relatively high effective gene density suprachromosomal contributors (described by s0 – s2) toward the interior of the nuclei. This condition then sets the basis for a self-organized arrangement where the lower effective gene density contributors (described by s5 – s6) are toward the periphery (direction of arrowhead). Schematic suggests multiple ways (plasticity in spatial CT arrangement) in which suprachromosomal units described by s5 – s6 occupy the periphery of the 3D nucleus, those described by s0 – s2 occupy the interior and s3 – s4 are intermediate to the 2. Solid contours imply suprachromosomal entities in the foreground while those in the background are shown using dashed contours.
