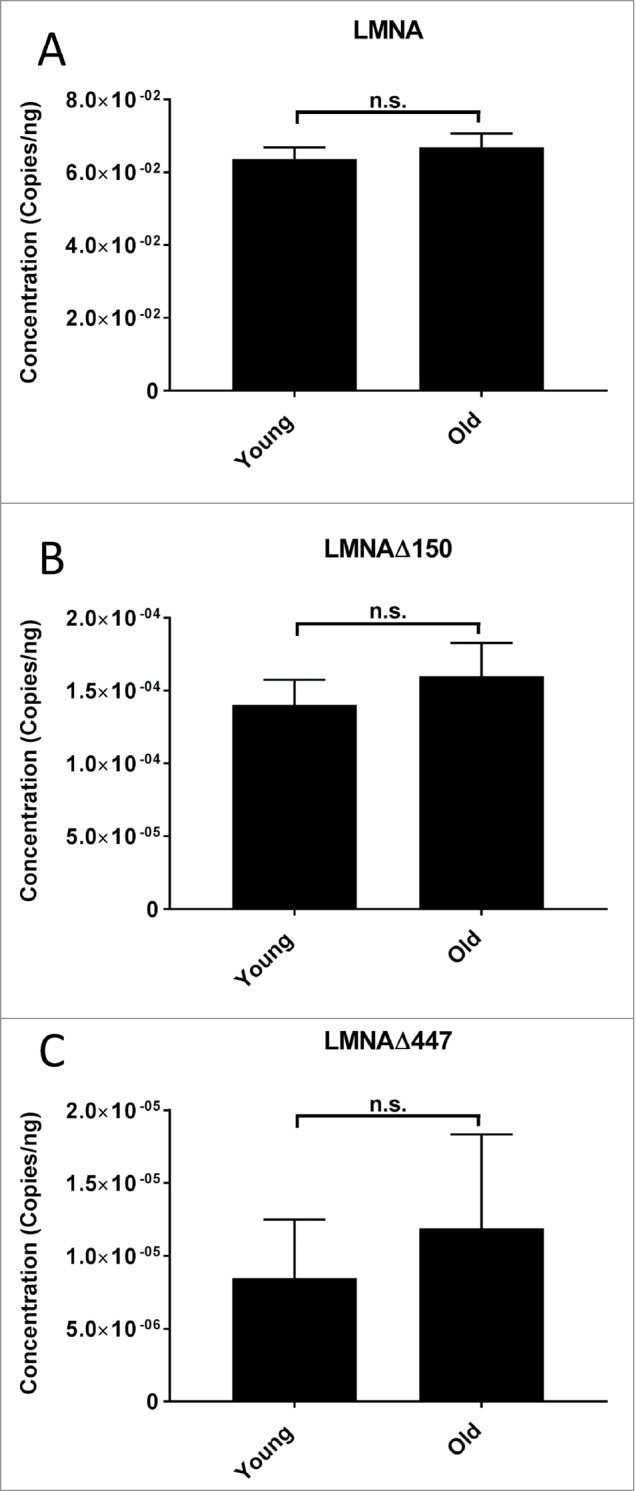
Figure 5.

LMNA isoform mRNA expression levels in young and aged cell lines. Levels of LMNA, LMNAΔ150, and LMNAΔ447 were measured by ddPCR in primary fibroblast cultures from biologically young (n = 9) and old donors (n = 10). (A) Average levels of LMNA expression for young and old groups. Difference in expression is non-significant (n.s.); (p>0.05, 2 tailed students T-test), SD are indicated. (B) Average levels of LMNAΔ150 expression for young and old groups. Difference in expression is non-significant (p>0.05), SD are indicated. (C) Average levels of LMNAΔ447 expression for young and old groups. Difference in expression is non-significant (p>0.1, 2 tailed students T-test), SD are indicated. Complete data for individual cell lines is given in Suppl. Fig. S5.
