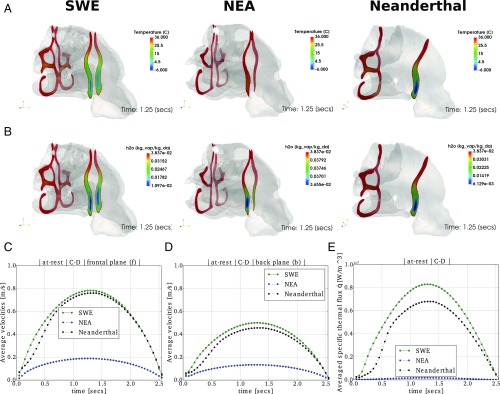
Fig. 2.
CFD model results. Temperature (°C) (A) and specific humidity [kgvap/kgda]) fields (B), at rest for forward (f: nasal vestibular zone) and backward (b: nasopharyngeal tract zone) planes when the pressure drop is maximum (t = 1.25 s; SI Appendix, Eq. S8) in cold-dry weather conditions for SWE, NEA, and Neanderthal. The temperature distribution in frontal planes f, when the breathing cycle reaches a maximum flow rate, shows that the mixture achieves the conditioning temperature faster for the NEA specimen, followed by Neanderthals showing an intermediate performance, especially in the superior part of the tract, and then by SWE, showing a relative worst performance. The temperature close to the oropharynx (plane b) is totally conditioned in NEA cavity and almost fully conditioned for the other two cavities. The moisture content or specific humidity at frontal planes follows the same behavior as the temperature field, being bigger in average for NEA nose, followed by Neanderthals and SWE. Specific humidity is in full saturation in plane b for NEA and almost saturated for Neanderthal and SWE noses. Averaged velocities at planes f and b are shown in C and D, respectively. It can be observed that the magnitude of the established velocities is 3.5–4 times bigger in the SWE and Neanderthal cavities than in NEA. Then, the residence time of a volume of mixture will be longer in NEA than in SWE and Neanderthals, enhancing the heat transfer from mucosa to the fluid and consequently the moist conditioning. E shows the volume-averaged specific thermal flux q = uavrgρcp(Twall − Tmix)Anose/Vnose(in [W/m2]) needed for the conditioning of each specimen. uavrg is the average of the velocity field using data of C and D, and Anose and Vnose are the mucosa surface area and nose volume (SI Appendix), respectively. See SI Appendix, Figs. S9 and S10 for further details.

