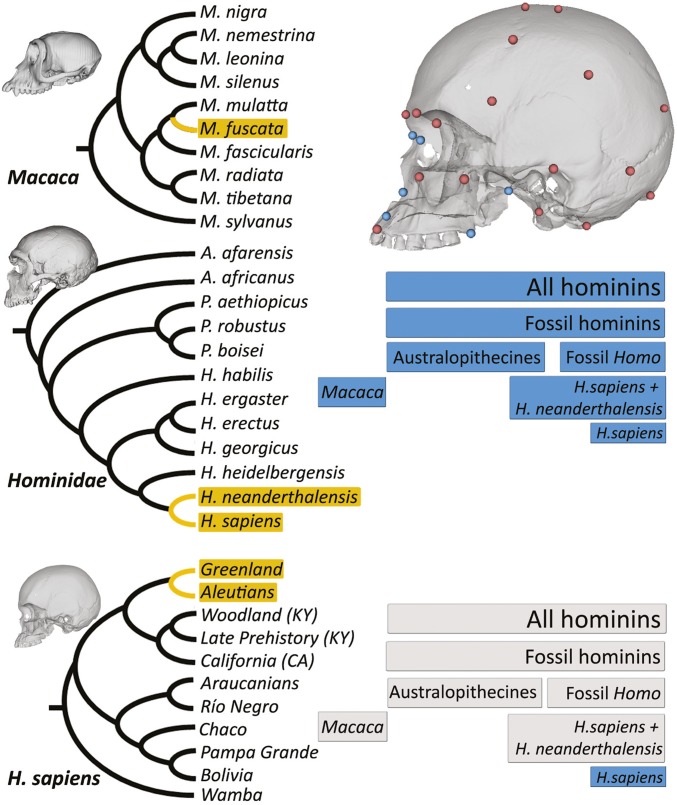
Fig. 3.
Phylogenetic framework and results for Lande’s genetic drift test. (Left) Cladograms depicting the position of cold-adapted species/populations (in terms of the ancestral climate condition, shown in yellow branches and boxes) in Macaca (Top), Hominidae (Middle), and Homo sapiens (Bottom) clades. Further details on samples characteristics can be found in SI Appendix, Table S5. See refs. 10, 30, and 31 for further discussion on this topic. (Right Top) Whole skull configuration (all dots) and nasal configuration (blue dots). (Right Middle and Right Bottom) Lande’s results for the hierarchical groups studied here: all hominins, H. sapiens populations, fossil hominins, Macaca genus, fossil Homo species, Australopithecines, H. sapiens + H. neanderthalensis, whole skull configuration (Middle scheme) and nasal configuration (Bottom scheme). Blue boxes, Lande’s results compatible with stabilizing selection operating at the taxonomic level under study; gray boxes, Lande’s results compatible with genetic drift.

