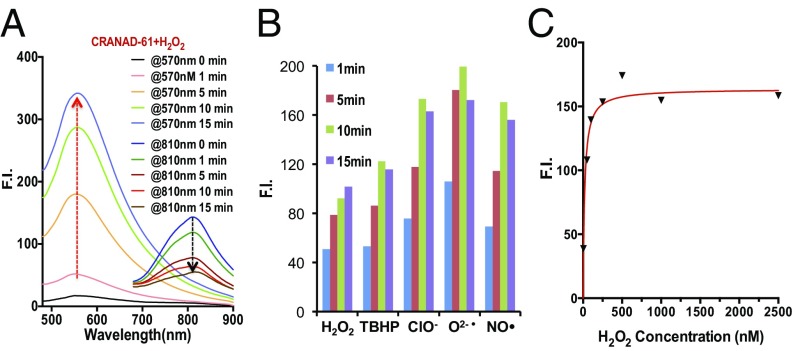
Fig. 3.
In vitro testing of CRANAD-61 with various ROS. (A) Fluorescence intensity (F.I.) increases at 570 nm after CRANAD-61 incubation with ROS at different time points (Ex = 460 nm). (B) Spectral changes of CRANAD-61 after incubating with H2O2 at different time points. Note the increase in intensity at 570 nm and decrease in intensity at 810 nm (Ex = 675 nm). (C) Concentration-dependent intensity change of CRANAD-61 with ROS (H2O2 as a representative).

