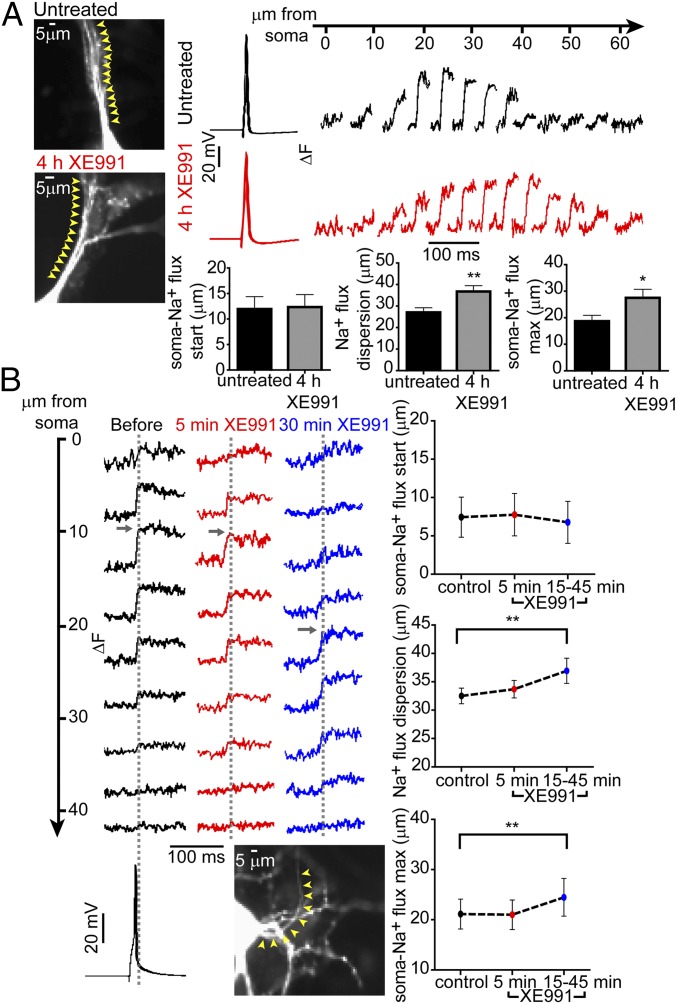
Fig. 3.
M-channel blockade rapidly elicits distal relocation of AP-evoked axonal Na+ flux. (A, Left) Images of an untreated neuron and a neuron exposed to XE991 for 4 h. Cells were patch-clamped and filled with SBFI. In the whole-cell configuration, a single AP was evoked, and Na+ imaging was performed simultaneously. Five-micrometer sections along the axon were selected, and changes in Na+ fluxes were tracked along these sections (yellow arrowheads). (Upper Right) Na+ imaging records from the neurons at the left; single APs induced a bell-shaped increase in Na+ flux changes along the AIS. (Lower Right) The distance between the soma and the start of Na+ flux changes did not change significantly between untreated neurons (n = 19) and neurons chronically treated with XE991 (n = 16). The dispersion of Na+ flux changes along the axon increased significantly after chronic XE991 treatment (two-tailed unpaired t test: **P = 0.0072, t = 2.867, df = 33). Moreover, the location of the peak Na+ flux changes was distally shifted away from the soma in neurons chronically treated with XE991 compared with untreated neurons (two-tailed unpaired t test: *P = 0.0305, t = 2.279, df = 28). (B, Upper Left) Representative Na+ flux change was tracked during XE991 exposure on the same cell. Na+ imaging was monitored every 5–10 min after XE991 application. The traces show Na+ flux changes along the AIS before XE991 exposure and after 5 min and 30 min of XE991 exposure. (Lower Left) Fast Na+ transients in the AIS were evoked by somatic single APs using a whole-cell patch-clamp electrode filled with SBFI. Each trace is a mean of the Na+ imaging intensity in an ∼5-µm-long section along the axon (yellow arrowheads). (Top Right) The distance between the soma and the start of the Na+ transients did not change (control, n = 18; 5 min, n = 18; 15–45 min, n = 12). (Middle Right) The dispersion of Na+ transients in the axon became significantly wider during prolonged XE991 exposure [two-tailed paired t test, control vs. 15–45 min (n = 12): **P = 0.0013, t = 4.296, df = 11]. (Bottom Right) The peak Na+ flux changes significantly shifted away from the soma during prolonged XE991 exposure [two-tailed paired t test, control vs. 15–45 min (n = 12): **P = 0.0087, t = 3.181, df = 11].

