Fig. 4.
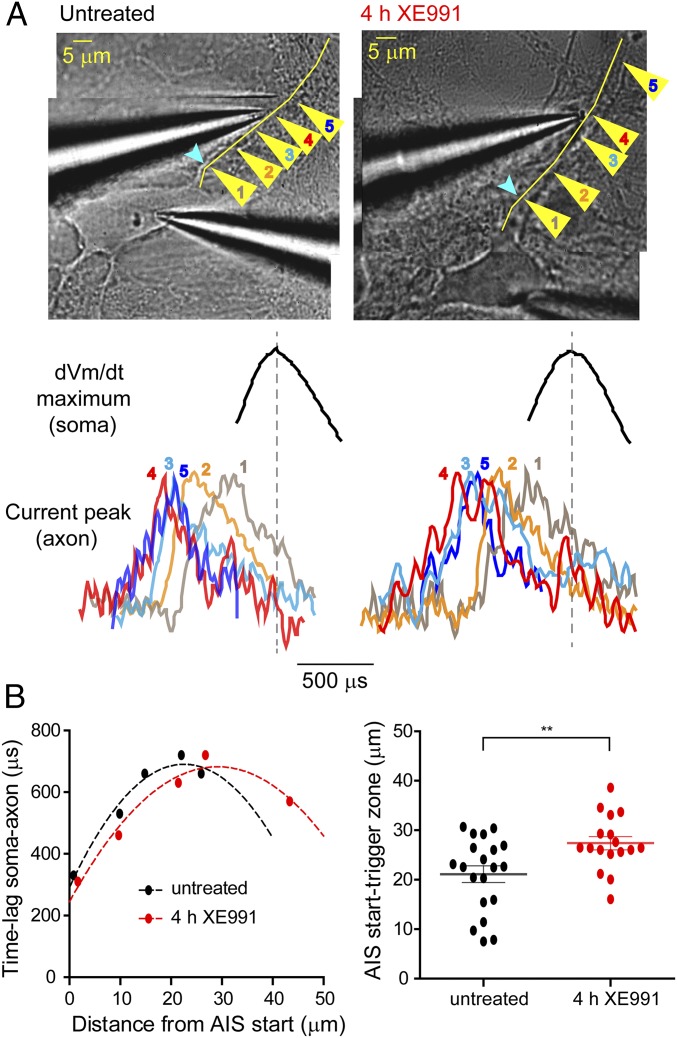
Distal shift of the axonal trigger zone following prolonged M-channel inhibition. (A, Upper) Representative superimposed images of an untreated neuron and a neuron treated with XE991 for 4 h and patch-clamped in the whole-cell configuration. The yellow arrowheads show the locations along the axon (1–5) where axonal action currents evoked by single somatic APs were recorded in the loose-patch configuration. The yellow line shows the track of the axon that was detected by SBFI Na+ imaging before dual-patch recordings. Light blue arrowheads show the start of the AIS (detected by SBFI-detected Na+ imaging). (Lower) Axonal action current normalized to the same amplitude and somatic dVm/dt maximum peak derived from triggered somatic APs. Somatic and axonal recordings were performed simultaneously at locations 1–5 along the axon. Location 4 (red) is the point where the delay between the axonal and somatic peaks was the largest, indicating that this point is on the trigger zone or is the point nearest to the trigger zone. (B, Left) Graph showing the points in A, with the untreated neuron shown in black and the neuron exposed to XE991 for 4 h shown in red. After prolonged XE991 exposure, the maximum lag time between somatic and axonal spike signals occurred farther from the start of the AIS. Dashed curves correspond to second-order polynomial fits. (Right) The spike trigger zone in neurons exposed to XE991 for 4 h was distally shifted away from the start of the AIS compared with untreated neurons. The values of the trigger zone were set as the vertex of the fitted curves (two-tailed unpaired t test: **P = 0.0073 untreated (n = 20) vs. 4 h XE991 (n = 17), t = 2.849, df = 35).

