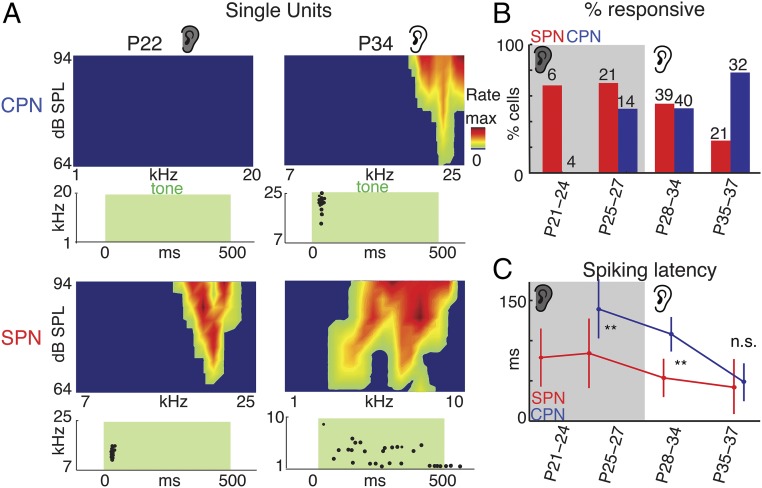
Fig. 2.
SP and L4 neurons respond to sound. (A) Spike raster plot and FRAs of exemplar neurons to pure tones (green shading) presented at 64–94 dB sound pressure level (SPL). Max rates are as follows: CP, 0.0 Hz, 3.4 Hz; SP, 2.8 Hz, 1.2 Hz. (B) Fraction of responsive and unresponsive CPNs and SPNs. Gray shading indicates when ears were closed. Numbers indicate recorded cells at each age and group. (C) First spike latencies (mean ± SD) to sounds for SPNs and CPNs. CPN latencies were adult-like by P35 (79). **P < 0.001. Since no CPNs responded at P21–P24, no latency could be measured.

