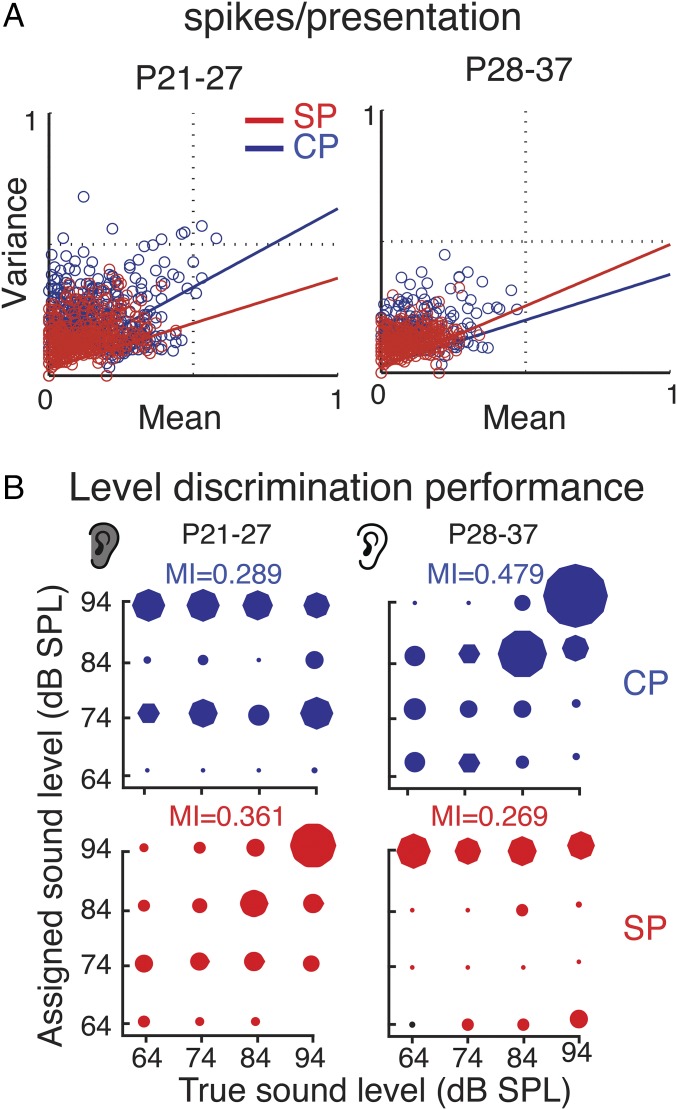
Fig. 3.
SP neurons encode sounds better than CP neurons at young ages. (A) Graphs show reliability (variance over mean) of spiking over repeated sound presentations for SP and CP neurons. Colored lines indicate linear regression. At young ages (Left), SP neurons show less variability, while at older ages CP neurons show lower variability. (B) Confusion matrices for sound level-based multiple discriminate analysis (MDA) classification. MDA was used to assign neural responses to individual stimuli according to intensity based on the spike count vectors for every stimulus repetition. The mutual information (MI) was calculated to quantify the relationship between the predicted and predictor variable.

