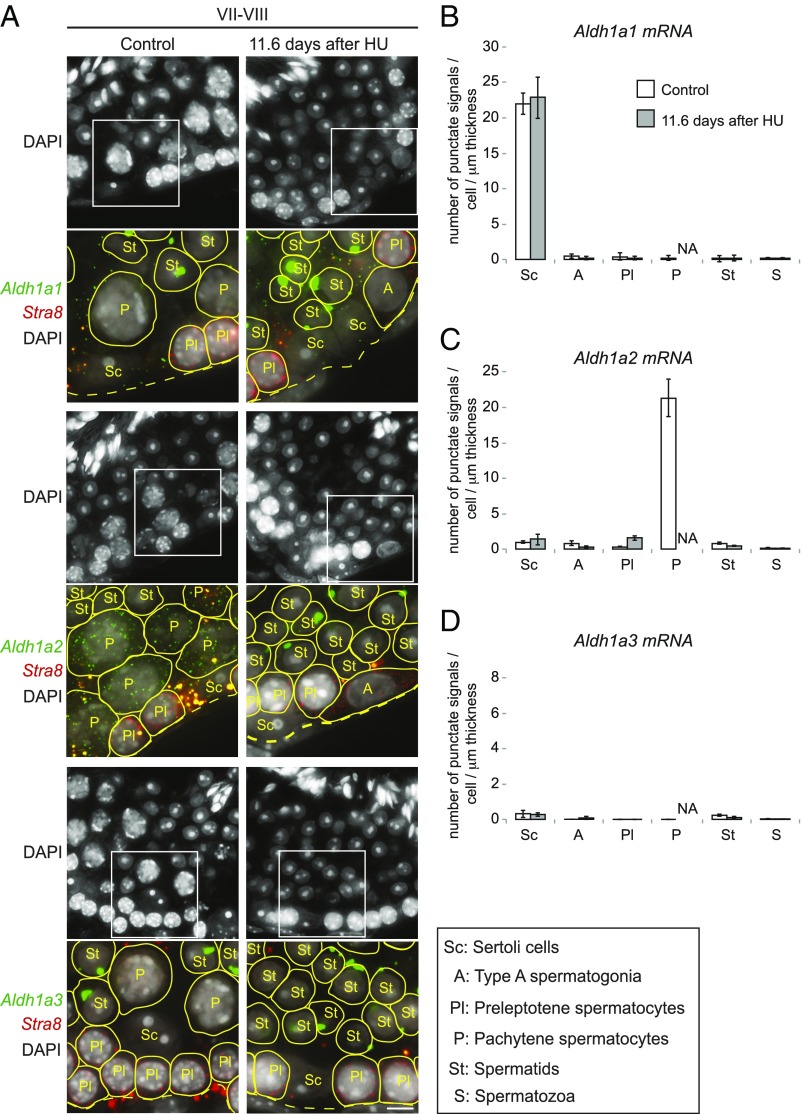
Fig. 6.
Depletion of pachytene spermatocytes reduces Aldh1a2 expression in seminiferous tubules. (A) Single-molecule fluorescence in situ hybridization (smFISH) for mRNAs of Aldh1a1 (green), Aldh1a2 (green), Aldh1a3 (green), and Stra8 (red), with DAPI counterstain (gray), on testis cross-sections in stages VII and VIII of control and HU-injected mice. Single transcripts are visible as punctate signals. Large spots in round spermatids are nonspecific signals (SI Results). Yellow spots in merged images are autofluorescent signals. Boxed regions (32.5 μm × 32.5 μm) in DAPI images (65 μm × 65 μm) indicate areas shown in higher magnification below each image. Yellow lines encircle germ cells, according to the cell borders visualized by overexposed images (see Fig. S7 A and B for details). A, type A spermatogonia; dashed lines, basal laminae of tubule cross-sections; Pl and P, preleptotene and pachytene spermatocytes; Sc, Sertoli cells; St, spermatids. (Scale bar: 5 μm.) (B–D) Number of smFISH punctate signals per cell per 1-μm section thickness for Aldh1a1 (B), Aldh1a2 (C), and Aldh1a3 (D) mRNA, in controls or 11.6 d after first HU injection. Error bars, mean ± SE. A, type A spermatogonia; NA, not applicable because no pachytene spermatocytes were present; Pl and P, preleptotene and pachytene spermatocytes; S, spermatozoa; Sc, Sertoli cells; St, spermatids.

