Fig. 1.
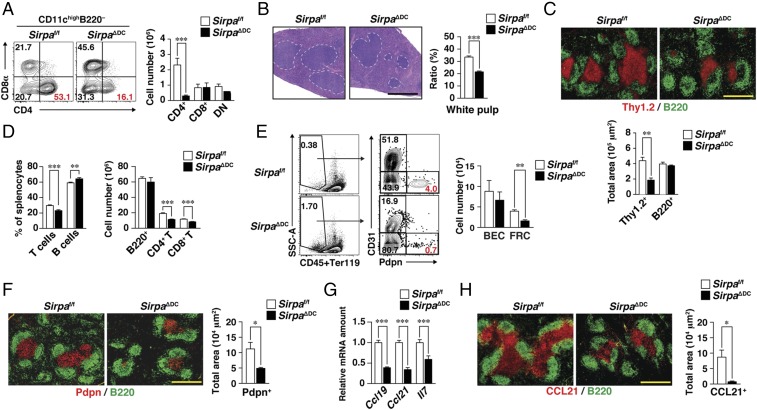
Importance of SIRPα on DCs for homeostasis of CD4+ cDCs, T cells, and FRCs in the spleen. (A) Splenocytes isolated from Sirpaf/f or SirpaΔDC mice at 8–12 wk of age were analyzed for cDC subsets by flow cytometry. Representative plots for CD4+ (CD4+CD8α−), CD8+ (CD4−CD8α+), and DN (CD4−CD8α−) subsets among CD11chighB220− cDCs (Left) and the absolute numbers of these cells (Right) are shown. (B, Left) Paraffin-embedded sections of the spleen from Sirpaf/f or SirpaΔDC mice were stained with H&E. Dashed lines demarcate white pulp area. (Right) The size of the white pulp area was determined as the percentage of total spleen area with the use of ImageJ software. (C, Upper) Frozen sections of the spleen from Sirpaf/f or SirpaΔDC mice were stained with antibodies to Thy1.2 (red) and B220 (green). (Scale bar, 500 μm.) (Lower) The Thy1.2+ or B220+ area in each image was measured with the use of ImageJ software. (D) Splenocytes isolated from Sirpaf/f or SirpaΔDC mice were stained for flow cytometric determination of the frequency of T cells (CD3ε+) and B cells (B220+) among total splenocytes (Left) or of the absolute numbers of B cells, CD4+ T cells (CD3ε+CD4+), and CD8+ T cells (CD3ε+CD8α+) (Right). (E) Splenocytes isolated from Sirpaf/f or SirpaΔDC mice were analyzed for SC subsets by flow cytometry. Representative plots for FRCs (CD31−Pdpn+) and BECs (CD31+Pdpn−) among Ter119−CD45− nonhematopoietic cells (Left) and the absolute numbers of these cells (Right) are shown. SSC, side scatter. (F) Frozen sections of the spleen from Sirpaf/f or SirpaΔDC mice were stained with antibodies to Pdpn (red) and to B220 (green) (Left), and the Pdpn+ area was measured in each image (Right). (G) Relative Ccl19, Ccl21, and Il7 mRNA abundance in the spleens of Sirpaf/f or SirpaΔDC mice. The amount of each target mRNA was normalized by that of Gapdh mRNA and expressed relative to the value for Sirpaf/f mice. (H) Frozen sections of the spleen from Sirpaf/f or SirpaΔDC mice were stained for CCL21 (red) and B220 (green) (Left), and the CCL21+ area was quantified in each image (Right). (Scale bar, 500 μm.) All quantitative data are pooled from three independent experiments and are expressed as means ± SE for three (A and E), five (B, C, F, and H), six (G), or eight (D) mice per group. *P < 0.05, **P < 0.01, ***P < 0.001 (Student’s t test).

