Fig. 2.
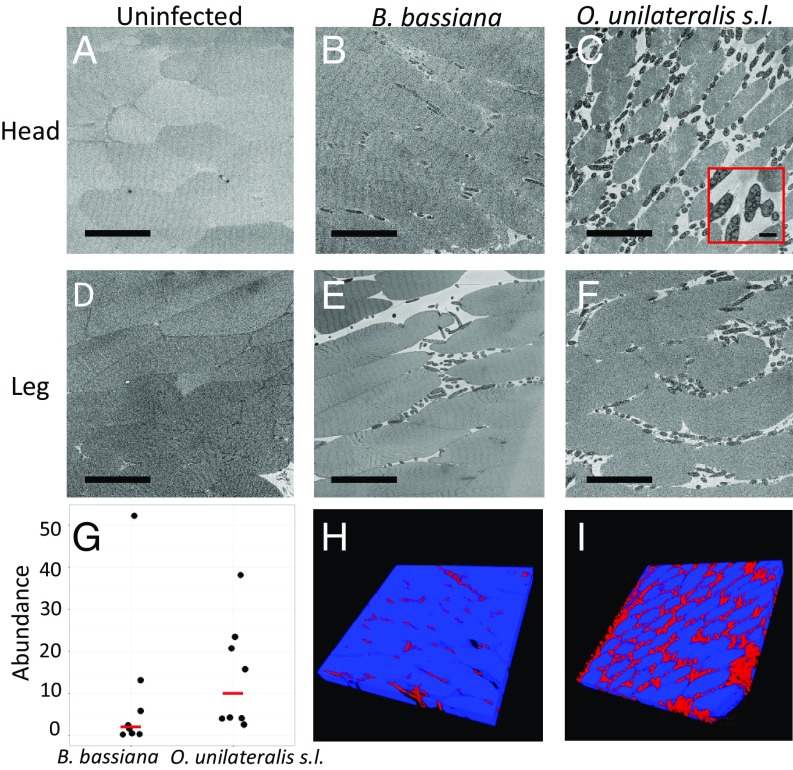
Fungal abundance in muscle tissue. Serial block-face SEM images from three different ants representing the three treatment groups in this study. (A–C) Images from head samples (mandible adductor muscles); (D–F) images from leg samples (coxal levator or depressor muscles). A and D represent the control group (uninfected ants). Note that the muscle fibers are densely packed together. B and E represent ants infected with B. bassiana. Fungal cells (dark gray) are present between the muscle fibers. C and F represent ants infected with O. unilateralis s.l. Again, fungal cells are present between the muscle fibers, and some are connected via CATs (Inset). (Scale bars, 50 µm; Inset, 5 µm.) (G) The percent of fungal tissue (compared with total muscle and fungal tissue) over a volume of 100 serial block-face SEM slices. Each point represents one ant infected with either B. bassiana or O. unilateralis s.l. Red lines indicate medians. (H and I) Three-dimensional volume projections of two of the 100-image stacks used to obtain the abundance data in G. These projections were generated from the same samples as B and C, respectively.

