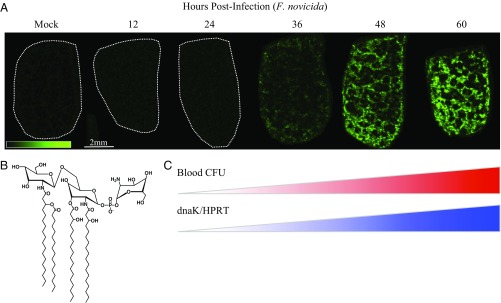
Fig. 1.
Endotoxin mapping in splenic red pulp by mass spectrometry imaging (MSI) corresponds to septic transition in mouse infection with F. novicida. (A) Ion image of F. novicida lipid A in bisected mouse spleen sections, 10-μm thickness, bisection face oriented up, 75-μm spatial resolution by matrix-assisted laser desorption/ionization-time of flight (MALDI-TOF). False color ion intensity is given in green color scale, 0–45 arbitrary units (a.u.) normalized, total ion current (TIC). Dotted white outlines are given for negative tissues. Data are representative of three parallel replicates. (B) Predominant structure of F. novicida lipid A given as the negative ion [M-H]− observed at m/z 1,665, supported by fragmentation (SI Appendix, Table S1). (C) Red heatbar: bacterial dissemination (F. novicida) to blood following subcutaneous infection (derived from SI Appendix, Fig. S3A), colony forming units (CFU) per milliliter (mL) cardiac blood, postmortem, n = 3 per time point. Blue heatbar: confirmation of bacterial transcript in the opposite halves of bisected spleens from A, qRT-PCR. F. novicida dnaK transcript is normalized to murine Hprt. n = 3 per time point (derived from SI Appendix, Fig. S3B).

