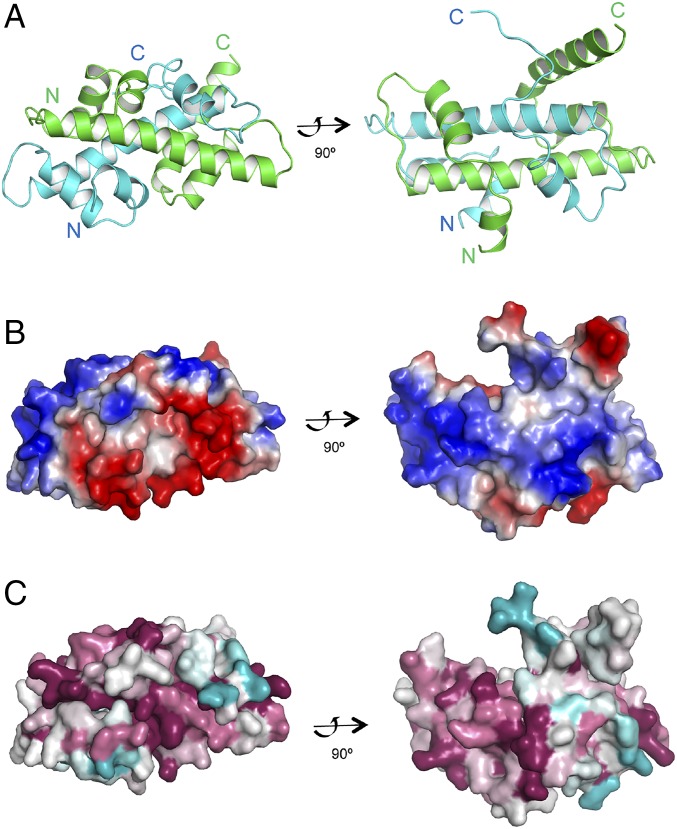
Fig. 4.
Crystal structure of the Dpb3–Dpb4 complex. (A) Ribbon drawing of the Dpb3–Dpb4 complex. Dpb3 is colored in cyan, and Dpb4 is colored in green. Right viewed as 90° rotation from Left. (B) Surface electrostatic properties of the Dpb3–Dpb4 complex. The contour level is at ±5 kT/e; red for negative potential and blue for positive potential. Right viewed as 90° rotation from Left. (C) Corresponding molecular surface of the Dpb3–Dpb4 complex in A is colored by sequence conservation as computed by ConSurf program based on sequences alignment from 500 nonredundant Dpb3 or Dpb4 homologous proteins.

